Tutorial Categories
Last Updated: January 29, 2026 at 19:30
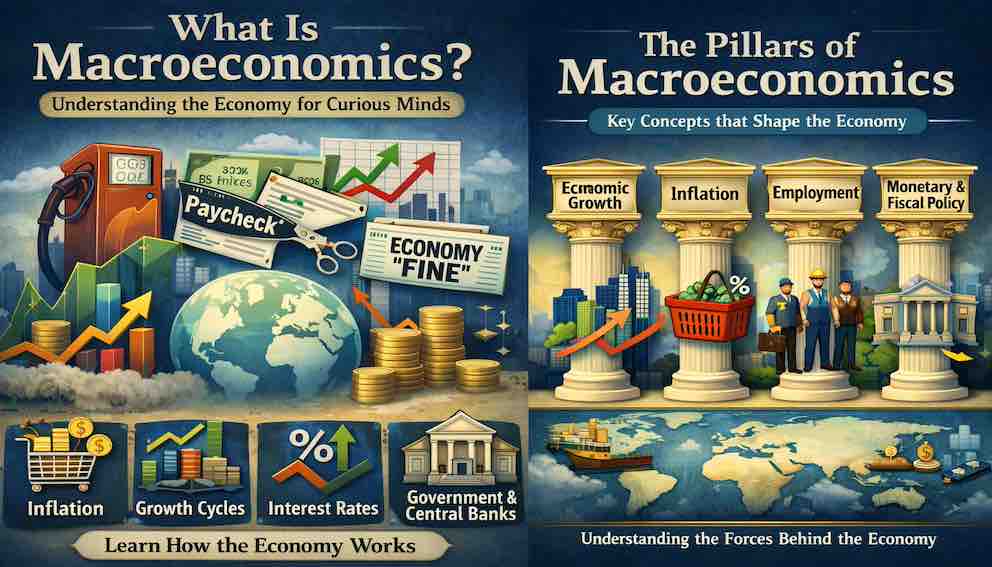
What Is Macroeconomics? Understanding the Economy for Curious Minds
Why do gas prices spike, paychecks feel tighter, and stock markets swing wildly—even when headlines insist the economy is "fine"? These aren’t random events. They’re the result of powerful, interconnected forces: inflation, economic growth cycles, interest rates, and government and central bank policies that touch every corner of your life. Our jargon-free macroeconomics tutorial series guides you through these forces step by step. You’ll discover: what macroeconomics really is, the key pillars that shape economies, how policies influence these pillars, how to interpret economic data to see the story behind the headlines. By the end of this series, you won’t just read the news—you’ll understand the patterns and connections that drive the economy. Ready to see the bigger picture others overlook? Start your journey today.
Imagine you’re at the grocery store. You notice that milk costs more than it did last year. At the same time, your favorite tech stock has been climbing—even though the economy feels sluggish. Your neighbor just landed a new job, while a friend was recently laid off.
What links all these experiences?
The answer lies in macroeconomics—the study of how the economy works as a whole.
In this tutorial series, you’ll learn what macroeconomics is, the core pillars that shape the economy, how those pillars are applied through policy, and why economic data matters when trying to understand what’s really happening beneath the headlines.
At first, the economy can feel confusing or overwhelming. But as you explore these ideas, patterns begin to emerge. You start to see why prices change, why markets move, and how everyday events connect to larger economic forces. Understanding this can be surprisingly exciting—it changes the way you see the world around you.
This series is designed for anyone curious about the economy—students, professionals, and everyday news readers alike. We focus on core principles, use familiar examples, and deliberately avoid heavy jargon, complex equations, and technical graphs.
By the end of this series, economic news will feel less random—and far more connected.
Economics Has Two Lenses: Micro and Macro
Before diving deeper, it helps to know that economics is studied at two different levels.
- One lens focuses on individual decisions—microeconomics—what people buy, how companies price products, and why firms hire or fire.
- The other lens looks at the combined outcome of millions of those decisions—macroeconomics—growth, inflation, recessions, and policy responses.
They answer different questions, but they are deeply connected. Understanding macroeconomics starts with knowing how it fits into this bigger framework.
Macroeconomics in Simple Words
At its core, macroeconomics is the study of the big-picture economy. It looks at overall trends: national income, employment, inflation, and economic growth. Think of it as observing the forest, rather than counting every tree. It looks at overall trends like growth, inflation, employment and policy - how an entire economy behaves, not just an individual or a company.
Macroeconomics doesn’t predict the future perfectly—You won’t get perfect forecasts, but macroeconomics gives you the lens to understand the economy’s direction. Knowing the principles helps you see why things happen—and skilfully applying them is where insight becomes an art.
Mini Takeaway: Macroeconomics helps you see the patterns behind economic headlines and market moves.
Microeconomics vs. Macroeconomics: The Big Difference
People often confuse micro and macro. Here’s a simple way to remember the distinction:
| Aspect | Microeconomics | Macroeconomics |
| Focus | Individual behavior and decision making (people, households, firms) | Economy-wide outcomes (national/global) |
| Typical Questions | Why does this company raise prices? | Why are prices rising everywhere? |
| Key Tools | Supply/demand, costs, incentives | GDP, inflation, unemployment, rates |
| Scope | Specific markets/industries | National/global economy |
| Time Horizon | Short- to medium-term decisions | Business cycles, long-term growth |
The difference isn’t about importance—both are essential. The real power comes from understanding how they interact.
Real-Life Examples: Micro vs. Macro in Action
Let’s bring this to life with a few concrete examples.
1. Prices and Inflation
- Micro level: A bakery raises bread prices because wheat costs have increased or it can’t find enough workers. This is about one business responding to its own costs and local conditions.
- Macro level: During 2021–2022, prices rose across groceries, housing, fuel, and services. This economy-wide increase is inflation, not just isolated price changes.
2. Interest Rates and Investment
- Micro level: A company decides whether to borrow money to build a new factory based on expected profits and loan costs.
- Macro level: In 2022, the U.S. Federal Reserve raised interest rates aggressively to fight inflation. Those hikes affected mortgages, business loans, stock valuations, and bond markets across the entire economy —not just one firm.
3. Employment and Business Cycles
- Micro level: A retail chain hires extra workers for the holiday season because it expects higher sales. A firm-level staffing choice.
- Macro level: During the 2008–2009 Global Financial Crisis, unemployment surged to around 10% in the U.S. as the entire economy contracted. That’s a macro labor-market outcome emerging from many individual hiring and firing decisions.
4. Supply Shocks
- Micro level: A coffee shop raises prices because its preferred bean supplier faces disruptions.
- Macro level: When global oil supply is disrupted by war or sanctions, fuel prices rise almost everywhere—pushing up transportation costs and feeding into overall inflation.
How Micro and Macro Fit Together
Microeconomics and macroeconomics are not rivals—they form a feedback loop.
- When inflation rises (macro), firms raise prices and cut costs (micro).
- When many businesses lay off workers (micro), unemployment rises nationally (macro).
The big picture (macro) is built from millions of small decisions (micro)—and those decisions are shaped by big-picture conditions.
Understanding this interaction is what makes macroeconomics such a powerful tool for interpreting the economy around you.
The Main Pillars of Macroeconomics
(And the Questions They Answer)
Macroeconomics is not a random collection of statistics.
At its core, it is a structured way of answering a few big, recurring questions about how an economy functions.
Over time, economists have found that most macroeconomic discussions—whether about inflation, recessions, or policy—fit naturally into a small number of core pillars. Each pillar focuses on a different dimension of the economy, but together they form a complete picture.
Let’s walk through these pillars one by one.
1. Economic Growth (Output)
What it is: Economic growth measures how much an economy produces over time. The most common measure is GDP (Gross Domestic Product)—the total value of goods and services produced.
Why it happens / Drivers: Over the long run, growth depends on structural forces such as:
- Investment and productivity
- Infrastructure and technology
- Education and skills
- Policy stability and institutions
Growth is not just about short-term spending or policy moves.
Why it matters / Effects:
- Determines whether incomes rise
- Creates jobs
- Improves living standards
- Too little growth → stagnation and unemployment
- Too much growth → overheating and inflation
Core Question: Is the economic pie getting bigger—or smaller?
Key Insight / Takeaway: Growth tells us whether an economy is creating opportunity or falling behind.
2. Inflation (Price Stability)
What it is: Inflation measures how quickly prices rise across the economy as a whole.
Why it happens / Drivers: Inflation tends to rise when:
- Demand outpaces supply
- Production costs increase
- Money grows faster than output
Why it matters / Effects:
- Determines purchasing power
- High inflation erodes savings and creates uncertainty
- Very low inflation (or deflation) can discourage spending and investment
Core Question: Is money losing value too quickly—or not enough?
Key Insight / Takeaway: Inflation shapes central bank decisions and affects every household and business.
3. Employment (Labor Market Health)
What it is: This pillar focuses on jobs, wages, and participation in the workforce.
Why it happens / Drivers: Employment is influenced by:
- Business hiring and layoffs
- Economic growth and recessions
- Labor market policies and incentives
Why it matters / Effects:
- Connects abstract economic growth to real lives
- Strong job markets support spending and confidence
- Weak job markets often signal stress or recession
Core Question: Are people able to find work and earn income?
Key Insight / Takeaway: Jobs are where macroeconomics becomes personal.
4. Economic Cycles (Booms and Recessions)
What it is: Economic activity does not grow smoothly. It moves in cycles—expansions, slowdowns, and recessions. Cycles are shaped not just by data and policy but by human behavior: optimism fuels expansion, fear and caution drive downturns.
Why it happens / Drivers: Economic cycles reflect imbalances that build up over time:
- Excessive borrowing
- Asset bubbles
- Overheating demand
Why it matters / Effects:
- Indicates where economies are in the cycle
- Helps societies anticipate risks and prepare for downturns
- Signals when policy intervention may be needed
Core Question: Where are we in the cycle—and what risks are building?
Key Insight / Takeaway: Understanding cycles helps societies prepare rather than react.
5. Monetary Conditions (Interest Rates & Liquidity)
What it is: This pillar focuses on the cost and availability of money, largely controlled by central banks through interest rates, liquidity provision, asset purchases or withdrawals.
Why it happens / Drivers: Central banks adjust monetary conditions to:
- Influence borrowing and spending
- Control inflation
- Stabilize the economy
Why it matters / Effects:
- Cheap money boosts borrowing and growth
- Tight money controls inflation but can slow the economy
Core Question: Is money cheap and plentiful—or expensive and scarce?
Key Insight / Takeaway: Interest rates are the main transmission channel of macroeconomic policy.
6. Fiscal Policy (Government Action)
What it is: Fiscal policy includes government spending, taxation, and deficits.
Why it happens / Drivers: Governments use fiscal policy to:
- Influence demand in the short term
- Boost infrastructure and productivity in the long term
Why it matters / Effects:
- Can stabilize or stimulate the economy
- Supports households and businesses during downturns
- Shapes long-term growth potential
Core Question: How is the government shaping demand and long-term growth?
Key Insight / Takeaway: Fiscal policy is a direct lever governments use to guide the economy.
7. Global Linkages (Trade, Capital, Currencies)
What it is: Modern economies are deeply interconnected through trade, capital flows, and exchange rates.
Why it happens / Drivers: Global linkages arise from:
- International trade of goods and services
- Cross-border capital flows
- Exchange rate fluctuations
Why it matters / Effects:
- Currency movements affect inflation and exports
- Trade disruptions cause shortages and price spikes
- Capital flows influence asset prices
Core Question: How does the rest of the world affect this economy?
Key Insight / Takeaway: Global linkages show that no economy operates in isolation—external forces can have major domestic impacts.
How the Pillars Fit Together
These pillars of macroeconomics do not operate in isolation. The economy is a system, and changes in one area ripple through the others. Let’s see how they interact.
- Strong growth → tight labor markets → wage pressure → inflation
Post-COVID rebound (2021): After lockdowns lifted, consumer demand surged. Factories and services ramped up production, hiring more workers to meet demand. Wages rose in many sectors, and combined with supply chain constraints, this contributed to rapid price increases globally.
Insight: This shows how growth and employment directly influence inflation — one pillar triggers effects across the system.
- High inflation → higher interest rates → slower growth
U.S. Fed Rate Hikes (2022): In response to post-pandemic inflation, the Federal Reserve raised rates aggressively. Mortgage costs increased, borrowing slowed, and investment cooled, illustrating how central bank actions link inflation to growth.
Insight: This demonstrates the interaction between inflation, monetary policy, and growth — one pillar’s pressure is mitigated or amplified by another.
- Government stimulus → stronger demand → possible inflation
COVID Stimulus Programs: Governments worldwide provided direct payments to households and loans to businesses. This increased spending power, revived economic activity, and in some cases contributed to higher inflation when supply could not keep pace.
Insight: Fiscal actions are closely linked to growth and inflation — policy choices in one area affect other pillars.
- Global shocks → trade disruptions → price changes → household & business impact
During the Russia–Ukraine War (2022), disruptions in energy and food exports caused global price increases. Higher costs rippled through international trade, affecting the prices of goods worldwide. Households faced higher expenses, businesses saw increased input costs, and inflation pressures spread across multiple economies. Similarly, when U.S. interest rates rose, the stronger dollar altered capital flows, reducing investment in emerging markets and creating additional economic strain abroad.
Insight: This shows how interconnected global trade, capital, and currencies are — a shock in one region can transmit through multiple pillars of the economy, affecting growth, inflation, and employment everywhere.
Why This Framework Matters
Understanding these macroeconomic pillars transforms how you interpret the economy. Economic headlines start to make sense, policy decisions feel logical, and market reactions stop feeling random. Think of the pillars as threads in a complex web: growth, employment, inflation, cycles, policy, and global forces all influence each other. By seeing these interactions, news and data stop being isolated events and form a coherent story. While uncertainty remains, confusion is replaced with context. We will discuss these pillars and indicators in more detail in future tutorials.
Policy in Action: How Governments and Central Banks Steer the Economy
The pillars of monetary and fiscal policy come alive when we see how policymakers use them to influence the economy. Think of central banks and governments as the captain and crew of a ship, adjusting their tools to guide the economy through calm waters or stormy seas.
Central Banks: The Economy’s Thermostat
Central banks control the cost of borrowing money, mainly through interest rates:
- Too hot (inflation): When prices rise too quickly, interest rates are raised to cool spending.
Example: In 2022, the U.S. Federal Reserve increased rates to slow inflation after strong post-pandemic demand and supply chain pressures.
- Too cold (recession): When economic activity slows, rates are cut to encourage borrowing and investment.
Example: In March 2020, during COVID-19 lockdowns, the Fed lowered rates to near zero to support households and businesses.
Governments: Fiscal Policy in Action
Governments influence demand and growth through spending, taxation, and stimulus:
- Stimulus programs inject money to boost spending and create jobs.
- Taxes slow consumption but fund essential services like healthcare and infrastructure.
- Targeted spending supports critical sectors during crises.
Example: In 2008, U.S. support for banks and auto companies helped stabilize the economy during the global financial crisis.
Mini Takeaway
Policymakers steer the economy using interest rates, spending, and taxes. Understanding these moves helps everyone—households, businesses, and citizens—anticipate how changes in policy can affect jobs, prices, and overall economic activity.
Macroeconomics and Data: Reading the Pulse of the Economy
To understand what’s happening in an economy, macroeconomists rely heavily on data: GDP, employment, inflation, wages, trade, and more. Headlines like “Jobs rose by X” or “GDP grew Y%” are useful signals—but they are almost always estimates, not precise counts.
Data is essential, but not absolute. Different analysts can interpret the same numbers in very different ways:
- Rising wages could be a sign of healthy demand…
- …or an early warning that inflation might rise and interest rates could increase.
- GDP growth may reflect a broad-based recovery…
- …or just a few booming sectors, masking weakness elsewhere.
How Interpretation Evolves
Over time, as economists gain experience, as more data accumulates, and as priorities change, the way data is interpreted also evolves.
For example:
- In the 1990s, productivity growth was the primary focus of many policymakers and economists.
- Today, attention has broadened to include labor force participation, inequality, and supply chain resilience—factors that influence not only growth but also stability and long-term economic well-being.
This demonstrates an important principle: data doesn’t just tell us what happened; it also shapes how we understand the economy and what we expect next.
Example: Employment Data (U.S. BLS Jobs Report)
The monthly BLS jobs report is a concrete way to see these ideas in action. It provides a snapshot of the labor market:
- Are companies hiring?
- Are people losing jobs?
- Are wages rising?
Why it matters:
Strong job growth signals a healthy economy, while weak growth or rising unemployment hints at a slowdown. Markets react strongly to this report: faster-than-expected wage growth can spook stocks, bonds, and currencies, as investors anticipate higher inflation and interest rates. In February 2022, faster-than-expected wage growth spooked markets, with stocks, bonds, and the dollar all reacting.
Limitations:
- Early reports are estimates; numbers are often revised.
- Seasonal adjustments may mislead if patterns change.
- Single-month movements matter less than trends over time.
This example illustrates how interpreting data requires judgment. The numbers themselves don’t tell the full story—understanding context and trends is key.
Interpreting Data: The Art and Science
Reading macroeconomic data is both a science and an art. Consider:
- Rising wages → strong demand? Or early inflation warning?
- GDP growth → broad-based recovery? Or concentrated in a few sectors?
By combining data with context, historical experience, and an understanding of the economy’s core pillars, you can see patterns behind the numbers, anticipate trends, and make informed interpretations of policy moves and market reactions.
Mini Takeaway
- Data gives a snapshot of the economy.
- How we read and interpret that data determines what we understand about growth, inflation, employment, and future trends.
- Mastery comes from observing patterns over time and connecting different indicators—not just reacting to individual headlines.
Common Misconceptions About Macroeconomics
- “Macroeconomics is guesswork.”
Not true. While precise predictions are impossible, macro provides a framework to understand patterns and make informed choices.
- “Good economy = good stock market.”
Markets are forward-looking. Stocks can fall in a strong economy if rates rise or valuations are stretched.
- “Experts always get it right.”
Macro is complex. Policymakers and economists interpret data differently, but understanding fundamentals gives you an edge.
Mini takeaway: Macro knowledge reduces confusion, even if uncertainty remains.
Apply and Observe
To truly master macroeconomics, you need to complete this series and get the fundamentals right—but that’s only the beginning.
Afterward, keep track of economic data, follow the news, read articles, and listen to analysis from diverse sources. Doing this will show you how the principles you’ve learned actually play out in the real world, helping you see patterns and connections.
Conclusion: The Big Picture
Macroeconomics is like reading the pulse of an entire economy. It explains:
- Why prices rise
- Why markets react
- Why policy decisions matter
Understanding macro doesn’t remove uncertainty—but it gives you a framework for smarter decisions in work, understanding government policy, and daily life.
Next steps in this series:
- Interpret economic data
- Anticipate trends
- See how big-picture forces shape your financial world
Think of it as a macro lens—helping you spot patterns others might miss. You don’t need a PhD—just curiosity, observation, and the ability to connect the dots.
References
- Mankiw, N. G. Principles of Economics (9th ed.). Cengage Learning.
- Friedman, M. (1963). Inflation: Causes and Consequences. Asia Publishing House.
- Blanchard, O. Macroeconomics (8th ed.). Pearson.
- Federal Reserve – Monetary Policy & Inflation https://www.federalreserve.gov
- U.S. Bureau of Labor Statistics (BLS) https://www.bls.gov
- International Monetary Fund (IMF) – World Economic Outlook https://www.imf.org
- World Bank – Macroeconomic Indicators https://www.worldbank.org
About Swati Sharma
Lead Editor at MyEyze, Economist & Finance Research WriterSwati Sharma is an economist with a Bachelor’s degree in Economics (Honours), CIPD Level 5 certification, and an MBA, and over 18 years of experience across management consulting, investment, and technology organizations. She specializes in research-driven financial education, focusing on economics, markets, and investor behavior, with a passion for making complex financial concepts clear, accurate, and accessible to a broad audience.
Disclaimer
This article is for educational purposes only and should not be interpreted as financial advice. Readers should consult a qualified financial professional before making investment decisions. Assistance from AI-powered generative tools was taken to format and improve language flow. While we strive for accuracy, this content may contain errors or omissions and should be independently verified.