Tutorial Categories
Last Updated: February 26, 2026 at 10:30
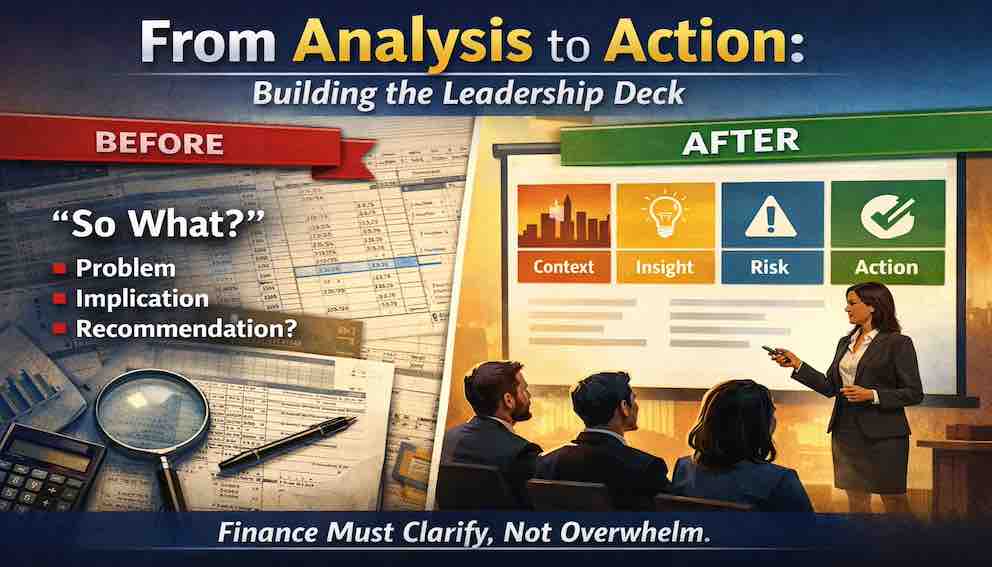
From Analysis to Action: Building the Leadership Deck for Effective Financial Communication
In finance, insight does not create value on its own. It creates value only when it changes a decision. This sounds obvious. Yet inside most organizations, a quiet gap exists between analysis and action. Finance teams build models, calculate variances, reconcile accounts, and identify trends. Leadership teams, meanwhile, must allocate resources, adjust strategy, and accept risk. Between those two worlds sits a fragile bridge: structured thinking. This tutorial is about that bridge. It is not about slide design. It is not about formatting. It is not about presentation tricks. It is about how finance professionals structure executive thinking—so that analysis becomes movement.
Introduction: Why the Leadership Deck Matters
Sarah, the Financial Planning & Analysis lead, sits at her desk, staring at a spreadsheet that has consumed the last three days of her life. Fifty rows of data. Twenty columns of analysis. Variances calculated. Drivers identified. KPIs tracked. Trends highlighted. She has done everything her previous tutorials taught: translated strategy into cash consequences, distinguished profit from liquidity, mastered the close cycle, and analyzed variances. All the technical work is perfect.
And yet, she knows the leadership team will not read this spreadsheet. In two hours, she will have thirty minutes to present. The CEO, CFO, and heads of sales, marketing, operations, and product will look at whatever she puts in front of them—and make decisions based on it. If her communication fails, the analysis is wasted.
The leadership deck is the bridge between insight and action. It transforms numbers into narratives that executives can quickly comprehend, understand the implications of, and act upon.
The Story of the Deck That Failed
Early in her career, Sarah prepared a detailed profitability analysis of the company’s product line. She built models, tested assumptions, and uncovered that a supposedly profitable product was actually losing money.
On presentation day, she walked the executives through every row and column of the spreadsheet, explaining her methodology in meticulous detail. She was thorough, precise, and complete.
The result? Thirty minutes in, the CEO checked his phone. The head of sales stared out the window. The CFO had a polite but vacant expression. No discussion. No decisions. No action.
Sarah had shown data, not insight. Methodology, not meaning. The conclusion was buried under so much detail that no one could find it. That experience shaped her approach forever.
The “So What?” Test: From Numbers to Insight
Sarah now has a simple rule: before putting anything in a presentation, she asks, “So what?”
- Why does this number matter?
- What is the implication for the business?
- If nothing changes, what happens?
- If something changes, what should it be?
For example, consider sales growth of 15% in a quarter. On the surface, a positive outcome. But applying the “So What?” test reveals:
- Revenue increased, but profit margins declined due to higher costs.
- Implication: Revenue growth alone may be masking declining profitability.
- Risk: Investors may be confused; misaligned incentives could encourage revenue at the expense of profit.
- Action: Revise sales incentives to include profitability metrics, renegotiate supplier contracts, or adjust pricing.
The “So What?” test turns raw numbers into actionable insight, ensuring every data point serves a purpose.
Structuring the Leadership Deck: The Four Pillars
Sarah uses a consistent structure she calls the four pillars. Each slide addresses: Context, Insight, Risk, Action.
1. Context
Set the stage. Explain the situation, the background, or the trend that the executive needs to know. Avoid dumping numbers without explanation.
Example: “Revenue trends in Q1 highlight a strong rebound in the Western region after operational disruptions in January.”
2. Insight
Interpret the data. Highlight patterns, anomalies, or key drivers.
Example: “Western region growth is driven primarily by increased demand in retail accounts, while other regions remain flat.”
3. Risk
Identify the consequences if action is delayed or misaligned.
Example: “If supply constraints in the West persist, sales could plateau in Q2, eroding the gains achieved this quarter.”
4. Action
Provide a clear recommendation.
Example: “Allocate additional inventory to the Western region and monitor supply chain performance weekly to sustain revenue growth.”
Slides can display these pillars in different ways: bullet points, visual flow left-to-right, or separate labeled sections. The key is consistency and clarity, not aesthetic complexity.
The Deck That Worked
Sarah learned the power of this structure during a working capital presentation. Days Sales Outstanding (DSO) had crept from 42 to 48 days over six months. Cash flow was tightening—a subtle but persistent trend.
Instead of showing a complex aging table, she built a single slide with the four pillars:
- Context: DSO increased from 42 to 48 days over six months; trend consistent across regions.
- Insight: Increase concentrated in enterprise customers; small businesses paying on time.
- Risk: Continued trend could force reliance on credit lines, raising interest costs by ~£200,000.
- Action: Meet with top enterprise customers to discuss terms, offer early payment discounts, and review new customer creditworthiness.
The CEO looked at the slide for thirty seconds. Decisions were made. Actions were assigned. The insight translated directly into impact.
Framing Problems Effectively
Finance professionals often report problems in purely technical terms: “Operating expenses increased by 12% this quarter.”
Executives need more than that—they need context and impact. Sarah recommends framing problems with three elements:
- State the issue clearly: “Operating expenses increased by 12% in Q1, driven largely by higher logistics costs.”
- Explain why it matters: “This exceeded budget forecasts and reduced profit margins by 4 percentage points.”
- Link to business outcomes: “Without corrective measures, annual profitability targets may be missed, affecting shareholder confidence and triggering debt covenant reviews.”
This structured framing enables executives to grasp problems quickly and make informed decisions.
Turning KPIs into Executive Narratives
KPIs tell a story only when placed in context. Consider customer churn rate:
- Number: 5% this quarter.
- Context: Up from 4.2% last quarter, 3.8% a year ago. Trend is accelerating.
- Drivers: Churn concentrated in small business segment (30% of revenue). Enterprise churn remains low.
- Implications: Annual revenue could fall £2 million short of forecast; customer acquisition costs may rise.
- Actions: Launch retention campaign, interview departing customers, consider product adjustments for small business segment.
Numbers alone are insufficient; narrative around them drives decisions.
Comparing Raw Analysis to Polished Presentations
Raw spreadsheets are often dense and overwhelming. Leadership decks distill them into actionable insight.
Example:
Spreadsheet: 50 rows of revenue, costs, and profit by product line and region. Accurate, complete—but overwhelming.
Deck Slide 1 – Revenue Performance: Bar chart of revenue by region, callout: “Western region up 15%, driven by retail channel.”
Deck Slide 2 – Margin Analysis: Line chart of gross margin trending downward; callout: “Margin compression due to logistics cost increases; negotiations underway.”
Deck Slide 3 – Recommendations:
- Allocate additional inventory to Western region.
- Complete carrier negotiations by month end.
- Launch small business retention campaign.
The spreadsheet shows all information; the deck shows insight and action.
Storytelling Principles in Financial Communication
Effective decks borrow storytelling principles:
- Start with the end: Open with the conclusion or recommendation.
- Highlight conflict: Identify deviations from plan, risks, or missed opportunities.
- Use visual anchors: Simple charts, graphs, or callouts convey trends efficiently. Avoid unnecessary complexity like 3D effects or excessive colors.
These principles make the deck engaging and memorable, ensuring executives understand both context and action.
Examples of Slide Structuring
Variance Analysis Slide:
Expense Category: Logistics
- Variance: +15% vs budget
- Insight: Costs spiked due to shipping delays and fuel increase
- Risk: Reduced margin by 2%; may continue
- Action: Negotiate contracts; explore alternative routes
Expense Category: Marketing
- Variance: -5% vs budget
- Insight: Digital campaigns underperformed; offline campaigns exceeded expectations
- Risk: Missed lead generation targets
- Action: Reallocate budget; track ROI weekly
KPI Slide:
- Metric: Cash Conversion Cycle (CCC)
- Trend: Increased from 45 to 52 days over six months
- Context: Receivables driving the increase
- Action: Contact top overdue accounts; review credit terms
Common Pitfalls and How to Avoid Them
- Overloading slides with numbers: Focus on key drivers and actionable insights. Put extra detail in appendices if necessary.
- Neglecting business impact: Always tie metrics to outcomes. Don’t just say “DSO increased by 3 days”; explain the cash impact and risks.
- Ignoring the audience: Understand executives’ priorities. Speak to what matters to them.
- Failing the “So What?” test: If a slide does not answer “Why does this matter?” remove it or reframe it.
Practicing Slide Development
Sarah encourages constant practice:
Take raw analysis and challenge yourself to create one slide per key finding.
Ask:
- Can an executive understand this in under two minutes?
- Is the insight actionable?
- Are risks highlighted?
- Does it tell a story without verbal explanation?
Over time, this practice bridges the gap between finance and strategic decision-making, improving both analysis and communication skills.
The Emotional Dimension: Why This Matters
All analysis is meaningless if it does not influence action. The leadership deck is where numbers become impact:
- A good deck leads to good decisions, better outcomes, and tangible impact on jobs, investments, and communities.
- A poor deck renders perfect analysis useless, leaving decisions uninformed and opportunities missed.
Conclusion: From Insight to Action
Sarah’s deck is ready: thirty minutes, twelve slides, each structured around context, insight, risk, action, answering the “So What?” question, and driving toward a decision.
In this tutorial, we:
- Explored the “So What?” test to convert data into insight.
- Learned the four-pillar structure for slides to ensure clarity and action.
- Practiced framing problems with issue, significance, and business outcome.
- Transformed KPIs into executive narratives with context, drivers, implications, and actions.
- Compared spreadsheets with polished decks to show the difference between overwhelming data and actionable insight.
- Applied storytelling principles: start with the end, highlight conflict, and use visual anchors.
- Recognized pitfalls and learned to avoid them.
- Understood that financial communication has an emotional dimension: our work matters only when it drives action.
Mastering these skills ensures finance professionals guide strategic decisions, create a culture where analysis informs action, and drive organizations toward their goals with clarity and confidence.
Sarah closes her laptop. The analysis is complete. The insight is clear. Now comes the moment when it all becomes real.
About Swati Sharma
Lead Editor at MyEyze, Economist & Finance Research WriterSwati Sharma is an economist with a Bachelor’s degree in Economics (Honours), CIPD Level 5 certification, and an MBA, and over 18 years of experience across management consulting, investment, and technology organizations. She specializes in research-driven financial education, focusing on economics, markets, and investor behavior, with a passion for making complex financial concepts clear, accurate, and accessible to a broad audience.
Disclaimer
This article is for educational purposes only and should not be interpreted as financial advice. Readers should consult a qualified financial professional before making investment decisions. Assistance from AI-powered generative tools was taken to format and improve language flow. While we strive for accuracy, this content may contain errors or omissions and should be independently verified.