Tutorial Categories
Last Updated: April 19, 2026 at 10:30
AD-AS Equilibrium: How Economies Determine Output, Prices, and Respond to Shocks
A Step-by-Step Guide to Short-Run Fluctuations, Long-Run Adjustments, and the Forces That Move the Economy
The AD-AS model is the workhorse framework of macroeconomics, bringing together aggregate demand (total spending) and aggregate supply (total production) to explain how an economy's output and price level are determined. This tutorial walks you through the concept of short-run equilibrium, where the economy can produce above or below its potential, and long-run equilibrium, where output returns to its full capacity and prices have fully adjusted. You will learn what happens when the economy is hit by different types of shocks – demand shocks like the dot-com bust of 2001 or the early 1990s recession, and supply shocks like the 1970s oil embargoes – and how the economy's self-correcting mechanism, guided by inflation expectations, gradually brings it back to potential output over time. Using real-world examples and acknowledging the practical challenges of time lags and uncertainty, you will see how the AD-AS model helps policymakers diagnose economic problems and why the appropriate policy response depends critically on whether a shock originates on the demand side or the supply side.
Introduction: Bringing the Two Sides of the Economy Together
We have spent several tutorials building the tools of macroeconomics piece by piece. We have learned about aggregate demand – the total spending in the economy from households, firms, the government, and foreign buyers. We have learned about aggregate supply – the total output that firms are willing and able to produce at different price levels, distinguishing between the short run where some prices and wages are sticky and the long run where they have fully adjusted. Now it is time to bring these two sides together.
The AD-AS model is the central framework of macroeconomics. It is the tool that economists use to explain why economies experience booms and recessions, why prices rise or fall, and how the economy responds to shocks like financial crises, oil price spikes, or sudden changes in business confidence. The model is built around a simple idea: the price level and the level of output in the economy are determined by the intersection of aggregate demand and aggregate supply, just as the price and quantity of a single good are determined by the intersection of demand and supply in a microeconomic market.
But there is an important twist. Because aggregate supply behaves differently in the short run than in the long run, the AD-AS model gives us two different pictures of the economy. In the short run, when some prices and wages are sticky, the economy can produce above or below its potential. In the long run, after all prices and wages have fully adjusted, the economy returns to its potential output. Understanding this distinction is the key to understanding how economies work and how policymakers should respond to economic disturbances.
Before we dive in, let us establish a simple mental picture of the AD-AS diagram. Imagine a graph with the overall price level on the vertical axis and real GDP (output) on the horizontal axis. The aggregate demand curve slopes downward: when the price level falls, real wealth increases and exports become more competitive, so total spending rises. The short-run aggregate supply curve slopes upward: when the price level rises, firms' profits increase because their costs are sticky, so they produce more. The long-run aggregate supply curve is vertical at the economy's potential output. The point where these curves intersect tells us the economy's current output and price level. A rightward shift of a curve increases output in the short run; an upward shift raises prices.
In this tutorial, we will walk through the concept of equilibrium in the AD-AS model, starting with the short run and then moving to the long run. We will explore what happens when the economy is hit by different types of shocks – demand shocks that shift the aggregate demand curve, and supply shocks that shift the aggregate supply curve. We will examine the economy's self-correcting mechanism, the process by which wages and prices adjust over time to bring the economy back to its potential, and we will pay special attention to the role of inflation expectations in this process. Finally, we will use real-world examples – including the early 1990s recession, the dot-com bust of 2001, and the 1970s oil shocks – to see how the model helps us understand actual economic events, while also acknowledging the practical challenges of time lags and uncertainty that policymakers face.
Short-Run Equilibrium – Where the Economy Is Right Now
In the short run, the economy's output and price level are determined by the intersection of the aggregate demand curve (AD) and the short-run aggregate supply curve (SRAS). This intersection represents the point where the total spending in the economy equals the total production that firms are willing to supply at that price level, given that some prices and wages are still sticky.
To understand this concept, imagine a simple economy that produces only one good – let us say bicycles. The aggregate demand curve shows how many bicycles households, businesses, the government, and foreign buyers want to purchase at different price levels. The short-run aggregate supply curve shows how many bicycles firms are willing to produce at different price levels, given that their wage costs and other input costs are fixed in the short run by contracts. The price level where the quantity demanded equals the quantity supplied is the equilibrium price. The quantity of bicycles bought and sold at that price is the equilibrium output.
In a real economy with millions of goods and services, the logic is exactly the same, except that we are dealing with the average price level across all goods and the total output of the entire economy. The point where the AD and SRAS curves cross tells us two things: the current price level and the current level of real GDP. It is important to distinguish between the price level – the average price of all goods and services at a point in time – and inflation, which is the rate of change of the price level over time. When we say the price level rises, we mean that inflation is positive. When we say the price level falls, we mean that inflation is negative (deflation).
What is important to understand is that in the short run, the economy can produce at a level that is different from its potential output. Potential output, also called full-employment output, is the level of production the economy would achieve if all prices and wages were fully flexible and all resources were fully employed. In the short run, because some wages and prices are sticky, the economy can produce above potential (a boom) or below potential (a recession).
Let us consider two different short-run equilibrium positions.
First, suppose the economy is in a recession. This means that aggregate demand is low. Households are nervous about their jobs and are saving more and spending less. Businesses are postponing investment because they see few customers. Exports may be weak because other economies are also struggling. The AD curve is far to the left. It intersects the SRAS curve at a point where output is below potential. At this intersection, unemployment is high, factories are running below capacity, and there is downward pressure on prices. A good example is the early 1990s recession in the United Kingdom. In 1990 and 1991, the economy contracted as high interest rates and falling house prices reduced household spending. Output fell below potential, and unemployment rose sharply.
Second, suppose the economy is in a boom. This means that aggregate demand is high. Households are confident and spending freely. Businesses are investing heavily because they see growing demand. Government spending may be high, or exports may be strong. The AD curve is far to the right. It intersects the SRAS curve at a point where output is above potential. At this intersection, unemployment is very low, factories are running at full capacity or even beyond (through overtime and temporary workers), and there is upward pressure on prices. The dot-com boom of the late 1990s in the United States is an example. Investment in technology companies surged, driving the AD curve to the right. Output rose above potential, and unemployment fell below 4 per cent.
In both cases, the economy is in short-run equilibrium – the intersection of AD and SRAS. But in one case, the equilibrium is below potential; in the other, it is above potential. This is the central insight of the AD-AS model: in the short run, because some prices and wages are sticky, the economy can be pushed away from its potential by changes in demand.
Key takeaway: Short-run equilibrium is determined by the intersection of AD and SRAS. In the short run, the economy can produce below potential (a recessionary gap) or above potential (an inflationary gap) because some wages and prices are sticky and cannot adjust instantly.
Long-Run Equilibrium – Where the Economy Tends to Go
In the long run, all prices and wages have had time to adjust. Contracts expire and are renegotiated. Menu costs are paid. Firms correct their misperceptions. In the long run, the economy's output is determined solely by its productive capacity – the quantity of labour, the stock of capital, and the level of technology. This is represented by the vertical long-run aggregate supply curve (LRAS).
Long-run equilibrium occurs at the intersection of the aggregate demand curve and the long-run aggregate supply curve. At this point, output equals potential output, and the price level is whatever it needs to be for that to happen. Importantly, in the long run, the economy cannot produce above its potential. If aggregate demand is very high, the price level will simply be higher, but output will remain at potential.
To understand why, let us return to the two examples we considered earlier. Suppose the economy is initially in a recession, with output below potential. What happens over time? Because output is below potential, unemployment is high. Workers who cannot find jobs are willing to accept lower wages. Existing workers, fearing layoffs, may also accept lower wages or smaller raises. As wages fall, firms' costs decrease. The short-run aggregate supply curve shifts to the right. This process continues until the economy returns to potential output. The recession gradually corrects itself, though the process can be painfully slow.
Now suppose the economy is initially in a boom, with output above potential. What happens over time? Because output is above potential, unemployment is very low. Workers are in high demand and can bargain for higher wages. Unions negotiate larger raises. Firms, facing higher labour costs, raise their prices. The short-run aggregate supply curve shifts to the left. This process continues until the economy returns to potential output. The boom gradually fades, and output returns to potential, but at a higher price level.
This process of adjustment is called the self-correcting mechanism of the economy. It is the reason why, in the long run, output always returns to potential. The speed of this adjustment depends on how quickly wages and prices adjust. In some economies, with flexible labour markets and low unionisation, adjustment can be relatively fast. In other economies, with strong unions, generous unemployment benefits, and rigid labour laws, adjustment can be very slow. This is why some countries experience long, painful recessions while others recover more quickly.
Key takeaway: Long-run equilibrium occurs at the intersection of AD and LRAS, where output equals potential. The self-correcting mechanism – changes in wages and prices over time – gradually brings the economy back to potential output after a shock, whether it started above or below potential.
The Crucial Role of Inflation Expectations
In the simple story above, the position of the short-run aggregate supply curve depends only on wages and input costs. But modern macroeconomics recognises that inflation expectations play an equally important role. If firms and workers expect higher inflation in the future, they will build those expectations into their decisions today, shifting the SRAS curve upward.
Why does this matter? Consider a situation where the central bank announces that it will keep interest rates low for an extended period. If households and firms believe this announcement, they may expect higher inflation in the future. Workers will demand higher wages today to compensate for the expected loss of purchasing power. Firms will raise prices today in anticipation of higher costs. The SRAS curve shifts upward, and inflation rises even before any change in output has occurred.
This is why central banks work so hard to anchor inflation expectations. If the public believes that the central bank will keep inflation low and stable, then expectations remain anchored, and the SRAS curve does not shift unexpectedly. If expectations become unanchored – if people start to believe that inflation will spiral out of control – then the SRAS curve can shift upward on its own, creating inflation without any increase in demand.
The distinction between expected and unexpected inflation is crucial. When inflation is higher than expected, firms find that their costs (which are based on expected inflation) are lower than their revenues. Profits rise, and they increase production. This is a movement along the SRAS curve. When inflation expectations themselves rise, the entire SRAS curve shifts upward. The economy ends up with higher inflation at every level of output.
The post-COVID period provides an example of this dynamic. In 2021 and 2022, as inflation surged, some surveys showed that consumers' expectations of future inflation had become unanchored. People began to expect that high inflation would persist. This shift in expectations itself contributed to inflation, as workers demanded higher wages and firms raised prices in anticipation. Central banks had to raise interest rates aggressively not just to cool demand, but also to re-anchor expectations and prevent the SRAS curve from shifting further upward.
Key takeaway: The position of the SRAS curve depends not only on wages and input costs but also on inflation expectations. If firms and workers expect higher inflation, they build those expectations into prices and wages today, shifting SRAS upward. Anchored expectations are essential for price stability.
Demand Shocks – When Spending Suddenly Changes
A demand shock is an unexpected event that causes the aggregate demand curve to shift. Demand shocks can be positive (an increase in spending) or negative (a decrease in spending). The source of the shock can be any of the components of aggregate demand: consumption, investment, government spending, or net exports.
A negative demand shock – a sudden fall in spending – shifts the AD curve to the left. In the short run, this reduces both output and the price level. Output falls below potential, and unemployment rises. The economy enters a recession. Over time, as we have seen, the self-correcting mechanism brings output back to potential, but the process can be slow and painful.
The early 1990s recession in the United Kingdom is a good example of a negative demand shock. In the late 1980s, the UK had experienced a boom driven by financial deregulation and rising house prices. When interest rates were raised to cool the economy, the boom turned to bust. House prices collapsed, and households who had borrowed heavily found themselves with negative equity. They cut back sharply on spending. Businesses, facing falling demand, cancelled investment plans. The AD curve shifted left. Output fell, and unemployment rose from around 6 per cent in 1990 to over 10 per cent in 1993. The recession was deep, and the recovery was slow.
A positive demand shock – a sudden increase in spending – shifts the AD curve to the right. In the short run, this raises both output and the price level. Output rises above potential, and unemployment falls below the natural rate. The economy enters a boom. Over time, the self-correcting mechanism brings output back to potential, but with a higher price level.
The dot-com boom of the late 1990s is an example of a positive demand shock. The rapid growth of the internet led to a wave of investment in technology companies. Stock prices soared, and households felt wealthier and increased their spending. Businesses invested heavily in new servers, software, and fibre optic cables. The AD curve shifted right. Output rose above potential, and unemployment fell below 4 per cent – the lowest level in three decades. Eventually, the boom faded, and the economy returned to potential, but not before the stock market bubble had burst.
Key takeaway: Negative demand shocks shift AD left, reducing output and prices in the short run. Positive demand shocks shift AD right, increasing output and prices. Over time, the self-correcting mechanism returns output to potential, but the adjustment can be slow, especially when wages are rigid downward.
Supply Shocks – When Production Suddenly Changes
A supply shock is an unexpected event that causes the short-run aggregate supply curve to shift. Supply shocks can also be positive (an increase in the economy's ability to produce at a given price level) or negative (a decrease). Negative supply shocks are particularly challenging for policymakers because they create a situation where output falls and prices rise at the same time – a combination called stagflation.
A negative supply shock shifts the SRAS curve to the left. At every price level, firms are willing to produce less because their costs have risen. In the short run, this reduces output (bad) and increases the price level (also bad). The economy experiences both recession and inflation simultaneously. This is the worst of both worlds, and it presents a dilemma for policymakers: if they try to fight the recession by increasing demand, they will make inflation worse; if they try to fight inflation by decreasing demand, they will make the recession worse.
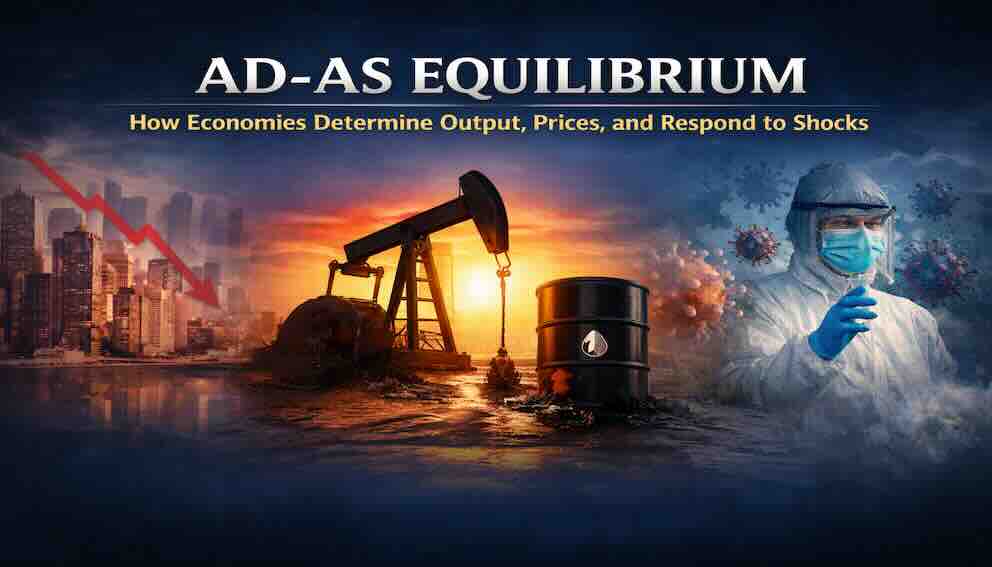
The 1970s oil shocks are the classic example of negative supply shocks. In 1973, Arab oil-producing countries imposed an oil embargo against countries that supported Israel in the Yom Kippur War. The price of crude oil quadrupled almost overnight. Then, in 1979, the Iranian Revolution caused another oil shock, and prices doubled again. Oil is a fundamental input into almost every industry – transportation, manufacturing, heating, electricity generation. When the price of oil rises sharply, the cost of producing almost everything rises. The SRAS curve shifted sharply to the left. The result was stagflation: output fell, unemployment rose, and inflation soared. In the United States, inflation reached 12 per cent in 1974 and again in 1979-1980, while unemployment remained high.
A positive supply shock shifts the SRAS curve to the right. At every price level, firms are willing to produce more because their costs have fallen or their productivity has increased. This increases output and reduces the price level – a welcome combination. Positive supply shocks are rarer but can occur when there is a technological breakthrough, a discovery of new resources, or a significant reduction in energy prices. The fracking revolution in the United States in the 2010s, which dramatically increased oil and natural gas production and lowered energy prices, was a positive supply shock that contributed to the strong growth and low inflation of that decade.
Key takeaway: Negative supply shocks (like the 1970s oil shocks) shift SRAS left, reducing output and increasing prices – stagflation. Positive supply shocks shift SRAS right, increasing output and reducing prices. Supply shocks are more difficult for policymakers to address than demand shocks because policies that help one problem often worsen the other.
The Self-Correcting Mechanism and the Role of Time
The self-correcting mechanism is the process by which the economy returns to potential output on its own, without government intervention, through adjustments in wages and prices. Understanding this mechanism is crucial for understanding why the long run is different from the short run and for evaluating arguments about whether governments should intervene during recessions.
Let us walk through the mechanism step by step for a recessionary gap. The economy is initially at a short-run equilibrium where output is below potential. Unemployment is high. Workers who cannot find jobs are willing to accept lower wages. Existing workers, fearing layoffs, may also accept lower wages or forgo raises. As wages fall, firms' costs decrease. Lower costs mean that at any given price level, firms are willing to produce more. The SRAS curve shifts to the right. This process continues – wages fall, SRAS shifts right – until output returns to potential. At the new long-run equilibrium, output is back at potential, but the price level is lower than it was initially. The recession has corrected itself.
Now let us walk through the mechanism for an inflationary gap. The economy is initially at a short-run equilibrium where output is above potential. Unemployment is very low. Workers are in high demand and can bargain for higher wages. Unions negotiate larger raises. As wages rise, firms' costs increase. Higher costs mean that at any given price level, firms are willing to produce less. The SRAS curve shifts to the left. This process continues – wages rise, SRAS shifts left – until output returns to potential. At the new long-run equilibrium, output is back at potential, but the price level is higher than it was initially.
The speed of this adjustment is critically important for policy. In theory, if wages and prices adjusted instantly, recessions would be very short, and governments would not need to intervene. But in reality, wages and prices adjust slowly. Contracts lock in wages for a year or more. Social norms against wage cuts make downward adjustment especially slow. This is why most economists argue that government intervention – through fiscal stimulus or monetary policy – is necessary during severe downturns. The self-correcting mechanism works, but it works too slowly for those who are suffering from unemployment.
Policymakers face three types of delays that complicate their response. First, there is the recognition lag – it takes time for economists to realise that a recession has started because data are released with a delay. Second, there is the implementation lag – even after a problem is recognised, it takes time for governments and central banks to design and enact policy responses. Third, there is the impact lag – once a policy is implemented, it takes time for its effects to be felt in the economy. These lags mean that by the time a policy takes effect, the economy may have already moved on. This is why some economists argue that discretionary policy can sometimes do more harm than good.
Policymakers also face profound uncertainty. In real time, they often do not know whether a shock is demand-driven or supply-driven. A rise in unemployment could be caused by a fall in demand (which calls for stimulus) or by a negative supply shock (which calls for a more cautious response). Misdiagnosing the shock can lead to policy mistakes. The stagflation of the 1970s was initially misinterpreted by many policymakers as a demand problem, leading to stimulus that made inflation worse.
Key takeaway: The self-correcting mechanism gradually brings the economy back to potential output, but it can be very slow. Policymakers face recognition lags, implementation lags, and impact lags, as well as uncertainty about the nature of the shock. This is the central justification for – and also a major challenge to – active government intervention.
Putting the AD-AS Model to Work – Diagnosing Economic Problems
One of the most valuable uses of the AD-AS model is that it helps economists and policymakers diagnose the source of an economic problem. The appropriate policy response depends entirely on what caused the problem in the first place.
If the economy is in a recession with falling output and falling prices (or disinflation), the likely cause is a negative demand shock. The AD curve has shifted left. The appropriate policy response is to increase aggregate demand – through expansionary monetary policy (lower interest rates) or expansionary fiscal policy (tax cuts or increased government spending). The early 1990s recession was primarily a demand-driven downturn, and the eventual recovery was supported by lower interest rates and a depreciation of the pound, which boosted exports.
If the economy is experiencing stagflation – falling output and rising prices – the likely cause is a negative supply shock. The SRAS curve has shifted left. This is a much harder problem to solve because the policies that help one side of the problem hurt the other. Expansionary policy to fight the recession would worsen inflation. Contractionary policy to fight inflation would worsen the recession. Policymakers must choose which problem is more urgent. In the early 1980s, the Federal Reserve decided that inflation was the more urgent problem and raised interest rates dramatically, causing a deep recession but eventually bringing inflation under control.
If the economy is in a boom with rising output and rising prices, the likely cause is a positive demand shock. The AD curve has shifted right. The appropriate policy response is contractionary – higher interest rates or reduced government spending – to cool the economy and prevent inflation from getting out of hand. This is what the Federal Reserve did in the late 1990s, raising interest rates to slow the economy and prevent the boom from turning into runaway inflation.
The key insight is that the same symptom – high unemployment – can have very different causes. High unemployment caused by a demand shock requires demand-side solutions. High unemployment caused by a supply shock may require supply-side solutions – policies to improve productivity, reduce input costs, or help workers retrain for new industries. Misdiagnosing the problem can lead to policy mistakes that make the situation worse.
Key takeaway: The AD-AS model helps diagnose economic problems. Recessions with falling prices usually indicate demand shocks, which respond to demand-side policies. Stagflation usually indicates supply shocks, which are much harder to address and may require supply-side solutions. Policymakers must act under uncertainty, often without knowing the true nature of the shock until after the fact.
Limitations of the AD-AS Model – What It Does Not Capture
The AD-AS model is an enormously useful tool, but it has important limitations that any serious student of macroeconomics should understand. Recognising these limitations prevents overconfidence in the model and helps us appreciate why economics is often more art than science.
First, the AD-AS model has no role for financial instability beyond simple demand shocks. The 2008 financial crisis was not just a sudden drop in spending; it was a near-meltdown of the entire financial system. Banks stopped lending, credit markets froze, and the normal channels of monetary policy broke down. The standard AD-AS model, with its clean curves, does not capture this kind of financial panic. Economists have developed extended models that include financial frictions, but the basic AD-AS framework assumes that credit is always available at the prevailing interest rate.
Second, the model assumes a single price level for the entire economy. In reality, different sectors experience different rates of inflation at different times. During the post-COVID recovery, used car prices soared while rent increases were more moderate. The AD-AS model cannot capture these relative price changes.
Third, the model does not formally model expectations. While we have added a discussion of inflation expectations, the basic AD-AS framework treats expectations as an external factor rather than something that emerges from the model itself. More advanced models, such as New Keynesian models, embed rational expectations and forward-looking behaviour, but they are mathematically much more complex.
Fourth, the model is weak on distributional effects. It tells us that output falls during a recession, but it does not tell us which groups are hurt the most. In reality, lower-paid workers, younger workers, and workers in vulnerable industries suffer disproportionately during downturns. The AD-AS model abstracts away from these important details.
Despite these limitations, the AD-AS model remains the essential starting point for macroeconomic analysis. It provides a clear, intuitive framework for understanding the relationship between demand, supply, output, and prices. It is the map that helps us navigate the economy, even if it leaves out some of the finer details.
Key takeaway: The AD-AS model has important limitations: it does not capture financial instability, it assumes a single price level, it does not formally model expectations, and it ignores distributional effects. But despite these limitations, it remains the essential starting point for macroeconomic analysis.
Conclusion: The AD-AS Model as a Map of the Economy
The AD-AS model is not a perfect representation of reality. It simplifies a great deal – it reduces the entire economy to two curves and a handful of shocks. But that simplification is its strength, not its weakness. The AD-AS model is a map, and like any good map, it leaves out many details to focus on what is essential. What is essential is the relationship between total spending (aggregate demand) and total production (aggregate supply), and how that relationship determines the economy's output and price level in the short run and the long run.
The model teaches us several enduring lessons. First, in the short run, because some wages and prices are sticky, changes in demand affect output and employment. This is why recessions happen, and this is why governments and central banks have a role to play in stabilising the economy. Second, in the long run, output is determined by the economy's productive capacity – its labour force, its capital stock, and its technology. Demand-side policies cannot make the economy grow faster in the long run; only supply-side improvements can do that. Third, the source of a shock matters enormously. Demand shocks and supply shocks look different, evolve differently, and require different policy responses. Misdiagnosing a supply shock as a demand shock – or vice versa – can lead to policy mistakes that make the situation worse. Fourth, inflation expectations are not a sideshow; they are central to the dynamics of the model. If expectations become unanchored, the SRAS curve can shift on its own, creating inflation without any increase in demand.
The economy is complex, and our ability to diagnose shocks in real time is limited. Policymakers face recognition lags, implementation lags, and impact lags, as well as profound uncertainty about the nature of the shocks they are confronting. By the time they have identified a shock, the economy may have already moved on. And the self-correcting mechanism, while real, can be painfully slow. Workers who lose their jobs in a recession cannot wait years for wages to fall enough to bring back employment.
This is why the debate over active policy versus laissez-faire is not an abstract academic debate; it is a debate about whether, and how, to help real people who are suffering real hardship. The AD-AS model does not settle that debate, but it provides the framework within which the debate must take place. It gives us a common language for talking about the economy, a set of tools for analysing economic events, and a foundation for thinking about what policies might work and which ones might not. That is why the AD-AS model remains, after decades, the first tool that economists reach for when they try to understand the economy.
About Swati Sharma
Lead Editor at MyEyze, Economist & Finance Research WriterSwati Sharma is an economist with a Bachelor’s degree in Economics (Honours), CIPD Level 5 certification, and an MBA, and over 18 years of experience across management consulting, investment, and technology organizations. She specializes in research-driven financial education, focusing on economics, markets, and investor behavior, with a passion for making complex financial concepts clear, accurate, and accessible to a broad audience.
Disclaimer
This article is for educational purposes only and should not be interpreted as financial advice. Readers should consult a qualified financial professional before making investment decisions. Assistance from AI-powered generative tools was taken to format and improve language flow. While we strive for accuracy, this content may contain errors or omissions and should be independently verified.