Tutorial Categories
Last Updated: May 7, 2026 at 18:30
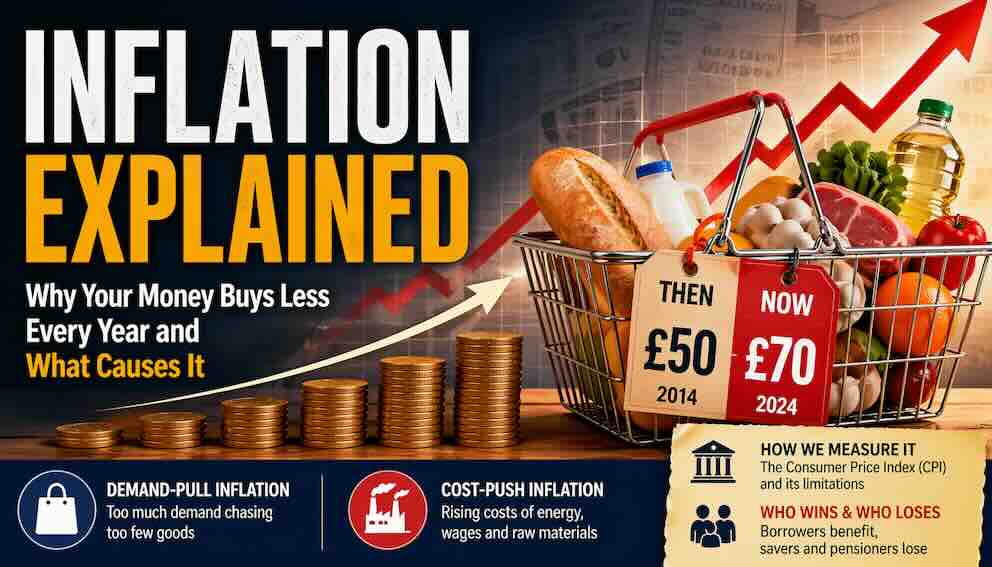
Inflation Explained: Why Your Money Buys Less Every Year and What Causes It
A Complete Guide to Understanding Demand-Pull Inflation, Cost-Push Inflation, How We Measure Rising Prices, and Who Gets Hurt When Inflation Strikes
This tutorial explains inflation – the sustained increase in the general price level that slowly erodes what your money can buy – in clear, everyday language with real-world examples you have lived through. You will learn the two main causes of inflation: demand-pull inflation, which happens when too much spending chases too few goods (like after the COVID-19 stimulus cheques), and cost-push inflation, which happens when rising energy or wage costs force businesses to raise prices (like during the 1970s oil crisis). The tutorial walks you through how inflation is measured using the Consumer Price Index and a basket of typical household goods, while also explaining the limitations of this measurement, including substitution bias (people switching from beef to chicken when beef gets expensive) and the challenge of accounting for new products like smartphones. Finally, you will discover the crucial difference between expected inflation (which is less harmful because people can plan for it) and unexpected inflation (which redistributes wealth arbitrarily), and you will learn who wins and who loses – borrowers often benefit because they repay loans with cheaper money, while lenders, savers, and people on fixed pensions see their purchasing power steadily destroyed.
What Inflation Really Means for Your Wallet
Imagine that you wake up one morning and discover that the price of everything you buy regularly – a loaf of bread, a gallon of petrol, a cinema ticket, your monthly rent – has gone up by about two per cent since last year. That does not sound so bad, does it? A loaf of bread that cost one pound now costs one pound and two pence. A cinema ticket that cost ten pounds now costs ten pounds and twenty pence. You might not even notice these small changes from week to week. But now imagine that this keeps happening, year after year. After ten years of two per cent inflation, that one pound loaf of bread costs about one pound and twenty-two pence. After twenty years, it costs about one pound and forty-nine pence. Your money is slowly but surely losing its power to buy things. This is inflation, and it is one of the most important forces shaping your economic life.
Inflation is defined as a sustained increase in the general price level across an entire economy. Notice the two key words here. The first key word is "sustained" – a one-off price rise, like when a storm destroys a crop and the price of oranges jumps for a month, is not inflation. Inflation is persistent; it keeps happening month after month, year after year. The second key word is "general" – inflation is not about the price of one thing going up while other things stay the same or fall. It is about prices rising across the board, for most goods and services that most people buy. When economists talk about inflation, they are not interested in why the price of coffee rose this month. They are interested in why the price of everything – food, housing, transport, entertainment, clothing – seems to be drifting upward over time. Inflation is a process, not a single event, and it becomes self-reinforcing: when people expect prices to rise, they demand higher wages, which forces businesses to raise prices, which confirms the original expectation.
It is also important to distinguish inflation from a simple change in relative prices. If the price of petrol rises because of a war in an oil-producing country, but the price of everything else stays the same, that is not inflation. That is a change in relative prices: petrol has become more expensive compared to other things. The rule is simple: if only some prices rise persistently while others stay flat or fall, that is a relative price change. If most prices rise persistently across the economy, that is inflation. This distinction matters because the solutions are different. A change in relative prices requires no policy response from the central bank. Inflation almost always does.
Demand-Pull Inflation – Too Much Money Chasing Too Few Goods
The first major cause of inflation is called demand-pull inflation, and the name tells you exactly what happens: demand pulls prices upward. Think of demand-pull as pressure coming from buyers. Imagine an economy where suddenly, for whatever reason, everyone wants to spend more money. Households decide to buy new cars and new furniture. Businesses decide to build new factories and buy new machines. The government decides to build new roads and hospitals. All of this extra spending means that the total demand for goods and services – what economists call aggregate demand – rises faster than the economy's ability to produce those goods and services. In the standard AD-AS (Aggregate Demand – Aggregate Supply) model that you will see in exams, demand-pull inflation is represented by a rightward shift of the aggregate demand curve. Businesses see their shelves emptying faster than they can restock them. They raise prices, not because they are greedy, but because raising prices is the only way to ration the limited supply of goods among all the people who want to buy them. This is the classic definition of demand-pull inflation: too much money chasing too few goods.
Demand-pull inflation is most likely to happen during economic booms. When the economy is growing quickly, unemployment is low, and wages are rising, people have more money to spend. They spend it, and that extra spending pushes prices up. Demand-pull inflation can also be caused by expansionary government policies. If the government cuts taxes, people have more disposable income to spend. If the government increases its own spending, that adds directly to aggregate demand. If the central bank cuts interest rates, borrowing becomes cheaper, so people take out loans to buy houses and cars and businesses take out loans to buy equipment. All of these policies can create demand-pull inflation if the economy is already operating near full capacity.
The most vivid real-world example of demand-pull inflation in recent memory happened after the COVID-19 pandemic. In 2020 and 2021, governments around the world sent massive stimulus payments to households – the United States sent twelve hundred dollar cheques to most adults, the United Kingdom paid up to eighty per cent of wages for furloughed workers, and many other countries did similar things. At the same time, central banks cut interest rates to near zero and bought trillions of dollars worth of government bonds. Households, stuck at home during lockdowns, had saved a huge amount of money because they could not go on holiday, eat at restaurants, or go to concerts. When lockdowns ended in 2021 and 2022, all that saved money was suddenly unleashed on the economy. People wanted to buy cars, furniture, holidays, and restaurant meals all at once. But the economy could not produce enough to keep up. Factories were still recovering from pandemic disruptions, supply chains were clogged, and workers were hard to find. The result was the highest inflation seen in many advanced economies since the early 1980s. In the United States, inflation peaked at over nine per cent in 2022. In the United Kingdom, it topped eleven per cent. Anyone who tried to buy a used car in 2022 will remember this vividly – prices jumped by thirty or forty per cent in some markets because demand was so strong and supply was so weak.
Key Takeaway – Demand-Pull Inflation: This occurs when aggregate demand shifts right faster than the economy can produce. It is caused by booms, tax cuts, low interest rates, or stimulus spending. It is typically fought by raising interest rates to cool spending.
Cost-Push Inflation – When Production Becomes More Expensive
The second major cause of inflation is cost-push inflation, and it works from the opposite direction. Think of cost-push as pressure coming from producers. Instead of being pulled upward by too much demand, prices are pushed upward by rising costs of production. In the AD-AS model, cost-push inflation is represented by a leftward shift of the short-run aggregate supply curve, meaning that the economy can produce less at every price level. When it becomes more expensive for businesses to produce their goods – because the raw materials they use cost more, because the energy they need to run their factories costs more, or because the workers they hire demand higher wages – they have two choices. They can absorb the higher costs and accept lower profits, or they can pass the higher costs along to their customers by raising prices. In most cases, businesses choose to raise prices, especially if their competitors are facing the same cost increases. The result is cost-push inflation.
There are three common sources of cost-push inflation. The first is energy shocks. When the price of oil, natural gas, or electricity rises sharply, almost every business in the economy feels the effect. Transport costs rise, so the price of delivering goods goes up. Heating costs rise, so the price of running factories and shops goes up. Chemical costs rise, because many plastics and fertilisers are made from oil. An energy shock can send inflation soaring across the entire economy. The second source is wage inflation. When workers successfully demand higher wages, businesses face higher labour costs. They raise prices to cover those higher wages. But higher prices then lead workers to demand even higher wages to maintain their purchasing power, creating a dangerous spiral that economists call a wage-price spiral. The third source is other supply shocks, such as disruptions to food supplies from bad harvests, disruptions to manufacturing from natural disasters or pandemics, or disruptions to trade from wars or tariffs.
The classic real-world example of cost-push inflation is the 1970s oil crisis. In 1973, Arab oil-producing countries cut off oil shipments to countries that supported Israel in the Yom Kippur War. The price of oil quadrupled almost overnight. Then, in 1979, the Iranian Revolution caused another oil shock, and prices doubled again. These energy shocks sent inflation soaring across the developed world. In the United States, inflation reached over twelve per cent in 1974 and again in 1979 and 1980. In the United Kingdom, inflation topped twenty-five per cent in 1975. This was not demand-pull inflation – the economies were not booming; in fact, they were in recession. It was cost-push inflation, driven by the price of energy. More recently, the war in Ukraine caused a similar but smaller energy shock in 2022. Russia was a major supplier of natural gas to Europe, and when the war disrupted those supplies, European energy prices spiked. That contributed significantly to the inflation that followed the pandemic. You could see this in your own gas and electricity bills, which doubled or tripled for millions of households.
The difference between demand-pull and cost-push inflation matters for policy. Demand-pull inflation can often be fought by raising interest rates to cool spending. Cost-push inflation is much harder to fight because raising interest rates does not fix a broken supply chain or bring down the price of oil. Raising rates might even make cost-push inflation worse by slowing the economy without addressing the root cause. This is why central banks faced such a difficult choice in 2022: raising interest rates would fight the demand-pull component but would do nothing about energy prices, and might cause a recession.
Key Takeaway – Cost-Push Inflation: This occurs when supply shocks (energy, wages, raw materials) shift the short-run aggregate supply curve left. It is harder for central banks to control because interest rate rises do not fix supply problems.
The Role of Central Banks – Fighting Inflation with Interest Rates
In most advanced economies, the job of controlling inflation belongs to the central bank – the Bank of England in the United Kingdom, the Federal Reserve in the United States, the European Central Bank in the Eurozone. These central banks have been given an explicit inflation target, usually around two per cent per year. The Bank of England, for example, aims to keep inflation at two per cent as measured by the Consumer Price Index. If inflation rises above two per cent, the central bank is expected to take action to bring it back down. If inflation falls below two per cent, the central bank is expected to take action to bring it back up.
The main tool that central banks use to control inflation is the interest rate. When the central bank raises interest rates, borrowing becomes more expensive for households and businesses. People take out fewer mortgages, buy fewer cars on credit, and cut back on spending. Businesses postpone investment projects. As spending falls, demand-pull inflation eases. Higher interest rates also tend to strengthen the currency, which makes imports cheaper and further reduces inflation. When the central bank cuts interest rates, the opposite happens: borrowing becomes cheaper, spending increases, and inflation tends to rise. This is why, when inflation surged after the pandemic, central banks around the world raised interest rates at the fastest pace in forty years. The Bank of England raised its base rate from 0.1 per cent in late 2021 to 5.25 per cent in 2024. The Federal Reserve raised its rate from near zero to over five per cent. These rate rises were painful – they caused mortgage payments to soar and made it harder for businesses to borrow – but they were necessary to bring inflation back under control.
However, central banks do not just respond to current inflation. They also try to manage inflation expectations. If people expect prices to rise rapidly in the future, they will demand higher wages today, and businesses will raise prices in anticipation of higher costs. These expectations can become self-fulfilling. This is why central banks work so hard to build credibility. If people trust that the central bank will bring inflation back to target, they will not build high inflation into their wage demands and price settings. The credibility of the central bank is one of the most valuable assets an economy can have. It took years of painful high interest rates in the 1980s for central banks like the Federal Reserve under Paul Volcker to convince the public that inflation would be controlled. Once that credibility was established, inflation remained low and stable for decades – until the pandemic and the Ukraine war disrupted everything.
Key Takeaway – Central Banks: Most advanced economies have an inflation target of around two per cent. Central banks raise interest rates to cool demand-pull inflation. They also work to manage inflation expectations because expectations can become self-fulfilling.
Measuring Inflation – The Consumer Price Index
If inflation is the rise in the general price level, we need a way to measure that rise. Economists cannot simply ask people how much they think prices have gone up, because people's memories are unreliable and their shopping baskets are different. Instead, they use a statistical tool called the Consumer Price Index, or CPI for short. The idea behind the CPI is simple, even if the actual calculation is complicated. Imagine that you want to measure how the cost of living has changed for a typical household. You first decide what a typical household buys. You make a list, called a basket of goods, that includes bread, milk, eggs, petrol, rent, electricity, bus fares, cinema tickets, new clothes, and hundreds of other items. You then go out and find out how much it costs to buy that entire basket of goods in the current year. You then compare that cost to the cost of buying the exact same basket of goods in a base year, which is a year you choose as a reference point. The percentage change in the cost of the basket is the inflation rate.
The formula for calculating the inflation rate is straightforward. You take the CPI in the current year, subtract the CPI in the previous year, divide by the CPI in the previous year, and then multiply by one hundred to turn it into a percentage. For example, if the CPI was 150 last year and it is 153 this year, the inflation rate is (153 minus 150) divided by 150, which is 3 divided by 150, which is 0.02, or two per cent. That means that the typical household's basket of goods cost two per cent more this year than it did last year. Every month, statistical agencies collect hundreds of thousands of prices to calculate the CPI.
However, the CPI has important limitations. The first limitation is substitution bias. When the price of beef goes up sharply, people buy more chicken. But the CPI basket is usually fixed, meaning it assumes people keep buying the same amount of beef even when it becomes expensive. This overstates inflation because people are not robots – they change their behaviour. If you have ever noticed that you started buying more own-brand products when inflation hit, you have experienced substitution bias. The official inflation figure may have said prices rose by ten per cent, but your personal inflation might have been lower because you switched to cheaper alternatives. The second limitation is quality changes. A smartphone today is vastly better than a smartphone from ten years ago. If the price stays the same, the true cost of getting that level of quality has actually fallen. The CPI attempts to adjust for quality, but it is imperfect. The third limitation is new goods. When smartphones first appeared, they were not in the CPI basket at all because the basket was based on older spending patterns. Value arrived before measurement caught up. These limitations mean the CPI is not perfect, but it remains the best tool we have.
Key Takeaway – Measuring Inflation: The CPI tracks the cost of a fixed basket of goods. It has limitations (substitution bias, quality changes, new goods) but is the standard measure. The inflation rate is the percentage change in the CPI.
Expected vs Unexpected Inflation – A Crucial Distinction
One of the most important concepts in understanding inflation is the difference between expected inflation and unexpected inflation. This distinction determines who wins, who loses, and how damaging inflation really is.
Expected inflation is inflation that people anticipate in advance. If everyone expects prices to rise by two per cent next year, workers will build that two per cent into their wage demands, landlords will build it into their rent increases, and banks will build it into their interest rates. A loan with a nominal interest rate of five per cent when inflation is expected to be two per cent gives a real interest rate (nominal minus inflation) of three per cent. Everything adjusts, and the main effect of expected inflation is simply that people have to go through the hassle of updating prices more often – the menu costs and shoe-leather costs we will discuss shortly. Expected inflation is annoying, but it is not economically devastating because people can plan around it.
Unexpected inflation is a different story entirely. When inflation turns out to be higher than everyone expected, it causes arbitrary redistribution of wealth. Borrowers win because they repay their loans with money that is worth less than they borrowed. Lenders lose because they are repaid with cheaper money. People on fixed pensions lose because their pension payments buy less than they planned. Workers whose wages do not keep up with inflation lose because their real wages fall. Savers lose because the real value of their savings is eroded. Unexpected inflation also creates uncertainty, making it hard for businesses to plan investment. The harm from inflation comes almost entirely from the unexpected component. This is why central banks try so hard to keep inflation low and predictable. When inflation is stable and expected, the economy can function normally. When inflation surprises people, it creates chaos.
A concrete example from everyday life: imagine you took out a fixed-rate mortgage in 2020 at two per cent interest. At that time, everyone expected inflation to stay around two per cent. Then, unexpectedly, inflation surged to ten per cent in 2022. Your wages probably rose somewhat (though maybe not by ten per cent), but your mortgage payment stayed the same. In real terms, you were repaying your mortgage with money that was worth much less than the money you borrowed. You, the borrower, won. The bank that lent you the money lost. If you were a saver with money in a bank account earning one per cent interest while inflation was ten per cent, you lost purchasing power dramatically. That unexpected inflation transferred wealth from savers to borrowers.
Key Takeaway – Expected vs Unexpected Inflation: Expected inflation is less harmful because people can plan around it. Unexpected inflation redistributes wealth arbitrarily from lenders to borrowers and from savers to debtors. This is why central banks prioritise predictability.
The Effects of Inflation on People and the Economy
Inflation affects real people in real ways, and those effects can be divided into micro effects (how individuals and individual businesses are affected) and macro effects (how the whole economy is affected).
At the micro level, the most obvious effect is the loss of purchasing power. When prices rise, each pound you have saved buys less than it used to. If you have five hundred pounds in a savings account earning one per cent interest, but inflation is running at three per cent, you are effectively losing two per cent of your purchasing power every year. Your money is shrinking in real terms even though the number on your bank statement is growing. This is why inflation is so painful for people on fixed incomes, such as pensioners whose state pension does not always keep up with prices, or workers whose employers do not give inflation-linked pay rises.
Two other micro effects have strange names but describe real costs that you have probably experienced without realising it. Menu costs are the costs businesses incur when they have to change their prices. When a coffee shop has to print new menus because the price of a latte has gone up, that costs time and money. When an online retailer has to update prices on thousands of products, that costs programmer hours. These costs may seem small for a single business, but when multiplied across millions of businesses in an economy, they add up to a significant waste of resources. Shoe-leather costs are named after the idea that people wear out their shoes walking to the bank more often. When inflation is high, holding cash becomes expensive because cash loses value every day. So people make more frequent trips to the bank to withdraw smaller amounts of cash, and they spend time and effort shopping around for better interest rates to protect their savings. These shoe-leather costs are the time, effort, and inconvenience people suffer as they try to minimise the damage inflation does to their money.
At the macro level, the most serious effect is uncertainty. When inflation is high and unpredictable, businesses cannot plan for the future. A business that is considering building a new factory needs to know what its costs and its revenues will be over the next ten years. If inflation could be five per cent or fifteen per cent, no one knows. That uncertainty leads businesses to postpone investment, which slows economic growth and reduces job creation. This is why central banks around the world target low and stable inflation – usually around two per cent – rather than zero inflation. A small amount of predictable inflation does not create much uncertainty, but high and volatile inflation is devastating for investment and growth.
Inflation also causes a major redistribution of wealth between borrowers and lenders, which we covered in the previous section. A related concept is the distinction between nominal and real values. The nominal value is the number of pounds on the price tag or in your bank account. The real value is what those pounds can actually buy. The real interest rate is the nominal interest rate minus the inflation rate. If you earn two per cent interest on your savings but inflation is three per cent, your real interest rate is negative one per cent – you are losing purchasing power even though the number in your account is growing. Understanding this distinction is essential for making sense of savings, loans, and investment decisions.
Key Takeaway – Effects of Inflation: Micro effects include loss of purchasing power, menu costs (changing prices), and shoe-leather costs (time spent protecting savings). Macro effects include uncertainty (reducing investment) and redistribution between borrowers and lenders. The real interest rate equals the nominal rate minus inflation.
A Note on Deflation – The Opposite Problem
It is worth briefly discussing deflation, which is the opposite of inflation: a sustained decrease in the general price level. Deflation sounds good – who does not want cheaper prices? – but it is actually very dangerous for an economy. When prices are falling, people delay spending because they expect things to be even cheaper next month. Why buy a new car today if it will cost five per cent less next year? This delay in spending reduces aggregate demand, which causes businesses to cut production and lay off workers, which reduces spending even further. This is a deflationary spiral, and it is very hard to escape once it starts.
Deflation also increases the real burden of debt. If you have a fixed-rate mortgage and prices are falling, your wages are likely falling too (or growing very slowly), but your mortgage payment stays the same in nominal terms. In real terms, your debt burden rises because the money you are earning is becoming more valuable while your payment stays fixed. This is why the Bank of Japan struggled for decades with deflation and why central banks generally prefer a small amount of positive inflation (around two per cent) to the risk of deflation. A little inflation is the lesser evil compared to even a small amount of deflation.
Key Takeaway – Deflation: Falling prices sound good but are dangerous because they cause delayed spending (people wait for lower prices) and increase the real burden of debt. Central banks target small positive inflation to avoid deflation.
Conclusion: Inflation Is Neither All Good nor All Bad
Inflation is one of the most discussed and least understood forces in economics. Many people assume that any inflation is bad, but that is not quite right. A small amount of predictable inflation – around two per cent per year – is generally considered healthy for an economy because it encourages spending and investment rather than hoarding cash, and it gives central banks room to cut interest rates during recessions. The real damage comes from high, unpredictable inflation that erodes savings, creates uncertainty, and redistributes wealth arbitrarily from savers to borrowers and from lenders to debtors. Understanding what causes inflation – whether it is demand-pull (too much spending) or cost-push (rising production costs) – is essential for knowing how to respond. Demand-pull inflation calls for cooling the economy with higher interest rates. Cost-push inflation is much harder to fight because raising interest rates does not fix a broken supply chain or bring down the price of oil. The inflation we experienced after the pandemic was a mixture of both, which is why it proved so stubborn and why central banks around the world struggled to bring it under control. The next time you notice that your shopping bill is higher than it used to be, or that the interest rate on your savings account is lower than the price increases you are seeing, you will know what questions to ask. Is this because people have too much money to spend? Or is it because the cost of producing things has gone up? And crucially, was this inflation expected or a surprise? The answers tell you not only what is happening but also who is winning, who is losing, and what can be done about it. Inflation is not a mystery to be feared. It is a process to be understood.
About Swati Sharma
Lead Editor at MyEyze, Economist & Finance Research WriterSwati Sharma is an economist with a Bachelor’s degree in Economics (Honours), CIPD Level 5 certification, and an MBA, and over 18 years of experience across management consulting, investment, and technology organizations. She specializes in research-driven financial education, focusing on economics, markets, and investor behavior, with a passion for making complex financial concepts clear, accurate, and accessible to a broad audience.
Disclaimer
This article is for educational purposes only and should not be interpreted as financial advice. Readers should consult a qualified financial professional before making investment decisions. Assistance from AI-powered generative tools was taken to format and improve language flow. While we strive for accuracy, this content may contain errors or omissions and should be independently verified.