Tutorial Categories
Last Updated: April 17, 2026 at 10:30
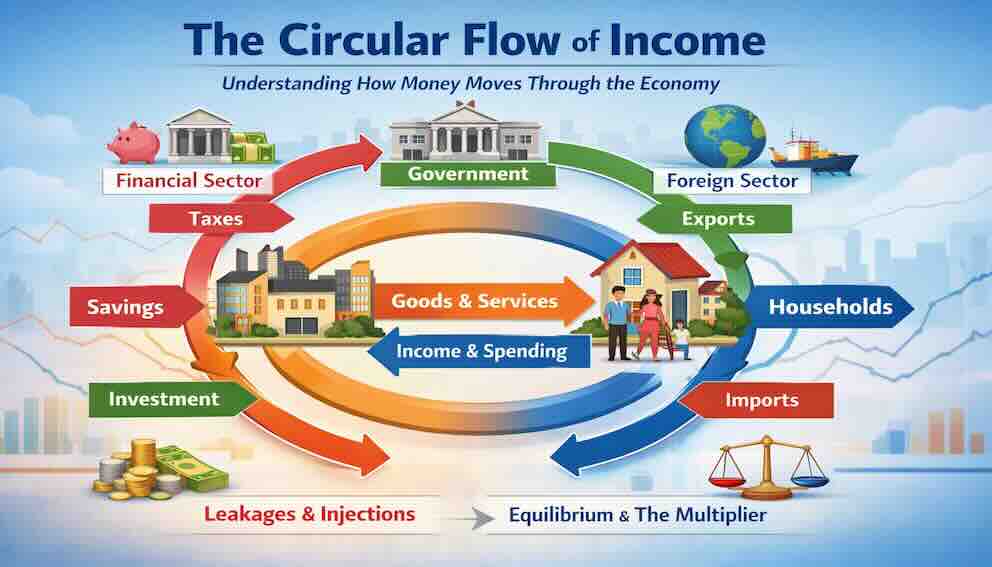
The Circular Flow of Income: Understanding How Money Moves Through the Economy
A Step-by-Step Guide to Households, Firms, Government, the Financial Sector, the Foreign Sector, Leakages, Injections, the Multiplier, and the Dynamics of Booms, Recessions, and Recoveries
This tutorial introduces the circular flow of income, one of the most fundamental models in macroeconomics for understanding how an economy functions. You will learn how money moves continuously between households, firms, the government, the financial sector, and the rest of the world. We will explore what happens when money leaks out through savings, taxes, and imports, and when it is injected back through investment, government spending, and exports. You will discover the concept of equilibrium—where planned leakages equal planned injections—and build an intuitive understanding of the multiplier, which explains why a small change in spending can ripple through the economy to produce a much larger change in output and employment. Using real-world examples from the Great Depression, the 2008 financial crisis, the COVID-19 pandemic, the Eurozone debt crisis, and the 2021–2023 inflation surge, this tutorial shows how this simple model illuminates the most important dynamics of modern macroeconomics.
Imagine a city where water circulates continuously through pipes, serving homes, businesses, and public facilities, before being treated and sent back out again. The system works as long as the water keeps moving and nothing blocks the pipes. If too much water is diverted or stored, pressure drops and parts of the city go dry. If too much water is pumped in, pressure builds and the system risks bursting.
The economy works in a remarkably similar way. Money circulates continuously through the system, moving from one group to another, being spent, earned, and spent again. This continuous circulation is what economists call the circular flow of income. Understanding this flow is essential because it reveals how the economy is structured, where money comes from, where it goes, and what happens when the flow is disrupted. It shows us that an economy is not a static collection of individuals and businesses but a dynamic system in which every transaction is connected to countless others.
One question that often arises when first encountering the circular flow is: how does the loop start? Firms need money to pay wages before they receive revenue from sales. The answer is that firms finance their initial production through borrowing (from banks or bond markets), retained earnings from past profits, or investment from owners and shareholders. Once the flow is established, it becomes self-sustaining—but the fact that production precedes spending in any given period is an important reminder that the circular flow is not a simple loop but a continuous process with financing at its foundation.
The circular flow model is deceptively simple. It begins with just two groups—households and firms—and shows how they interact. But from this simple beginning, we can add layers of complexity: the government, which taxes and spends; the financial sector, which channels savings into investment and creates new money through lending; and the foreign sector, which brings in exports and sends out imports. With each addition, the model becomes more realistic and more powerful as a tool for understanding real-world economic events. By the end of this tutorial, you will see how this single framework can explain why economies sometimes stagnate, why government stimulus can boost growth, why a small change in spending can ripple through the economy to produce a much larger effect, and how the model underlies the actual measurement of Gross Domestic Product (GDP) .
The Simplest Flow – Households and Firms
At the most basic level, every economy consists of two types of economic actors: households and firms. Households are the individuals and families who consume goods and services, and who own the factors of production—labor, land, capital—that make production possible. Firms are the businesses that produce goods and services, employing the factors of production that households provide. The circular flow between these two groups has two sides: the real flow of goods and services and the financial flow of money.
On one side of the flow, households provide labor to firms. A worker goes to a factory, an office, or a store and contributes their time and skills to the production process. This is a real flow—the movement of labor from households to firms. In return, firms pay wages and salaries. That money flows from firms back to households. This is the financial flow. Now households, armed with this income, go to the market to buy goods and services—groceries, clothing, entertainment, housing. This spending is a financial flow from households to firms. In return, firms provide households with the goods and services they purchased—a real flow from firms to households.
If we draw this as a diagram, we see a circle. Money flows from firms to households as wages and salaries. It then flows from households back to firms as spending on goods and services. At the same time, real resources—labor and the output of goods—flow in the opposite direction. This simple loop is the foundation of all economic activity. Every transaction in the economy is part of this flow, and the total value of the flow in one direction equals the total value in the other direction. The amount households earn is exactly the amount they spend on goods and services, and the amount firms receive from sales is exactly the amount they pay out in wages and other costs.
This simple model reveals something important: one person's spending is another person's income. When a household buys a loaf of bread, that spending becomes income for the baker. When the baker spends that income on flour, it becomes income for the farmer. When the farmer spends it on seed, it becomes income for the seed supplier. This chain of spending and income is what makes the economy work. If households stop spending, firms lose income and lay off workers. Those laid-off workers then have less income to spend, which leads to further declines in spending, and the cycle spirals downward. This is exactly what happened during the Great Depression of the 1930s and, in a more acute but shorter form, during the COVID-19 recession of 2020.
Key takeaway: In the two-sector model, all income originates from firms and returns to firms as consumption expenditure. The total value of output produced by firms equals the total income earned by households, which equals the total spending by households. This identity—output = income = expenditure—is the foundation of national income accounting, the system used to calculate Gross Domestic Product (GDP) . From this model, we can see that GDP can be measured as total output, total income, or total expenditure—all three approaches yield the same number.
Adding the Government – Taxes, Spending, and Automatic Stabilizers
The two-sector model of households and firms is useful, but real economies are more complex. Every modern economy includes a government that taxes, spends, and transfers money. The government enters the circular flow in two ways: it withdraws money through taxes, and it injects money through government spending and transfer payments.
When the government collects taxes—from households through income taxes and sales taxes, and from firms through corporate taxes—it removes money from the circular flow. This is called a leakage or a withdrawal. The money that households and firms would otherwise spend or invest is taken out of the system. But the government also puts money back into the flow. It spends money on public goods and services—roads, schools, national defense, police and fire services. This is government spending (G) , an injection. It also makes transfer payments, such as Social Security benefits, unemployment insurance, and welfare payments, which put money directly into the hands of households without requiring them to provide goods or services in return. Transfer payments are also considered injections because they add to household income.
An important feature of modern government is the presence of automatic stabilizers—mechanisms that automatically adjust leakages and injections in response to the business cycle without the need for new legislation. Unemployment insurance is a classic example: when the economy enters a recession and people lose jobs, unemployment benefits automatically increase, injecting more money into the circular flow just when it is needed most. The tax system works similarly: when incomes fall, tax revenues fall automatically, which reduces the leakage from the circular flow and leaves households with more disposable income than they would otherwise have. These automatic stabilizers help cushion recessions without requiring policymakers to act.
When the government spends more than it collects in taxes, it runs a budget deficit. In this case, the government is injecting more money into the circular flow than it is withdrawing. When it collects more than it spends, it runs a budget surplus, withdrawing more than it injects. This distinction matters enormously for the economy. During a recession, when private sector spending is weak, a government can deliberately run a deficit—spending more than it taxes—to inject money into the circular flow and boost demand. This is exactly what happened during the 2008 financial crisis and again during the COVID-19 pandemic. The stimulus checks that the U.S. government sent to households in 2020 and 2021 were direct injections into the circular flow, intended to replace the spending that had collapsed when businesses closed and people lost jobs.
The government's role as both a leakage (taxes) and an injection (spending and transfers) gives it a powerful tool for managing the economy. By adjusting taxes and spending, it can influence the overall level of demand and, in doing so, help stabilize the business cycle. This is the essence of fiscal policy.
Key takeaway: Government introduces two new flows into the circular flow: taxes, which are a leakage, and government spending (including transfers), which is an injection. Automatic stabilizers like unemployment insurance and progressive taxes help stabilize the economy automatically, while discretionary fiscal policy allows governments to respond to severe downturns.
Adding the Financial Sector – Savings, Investment, and Credit Creation
In the simplest two-sector model, households spend all of their income. But in reality, households do not spend every dollar they earn. Some of their income is saved—put aside for future use, deposited in bank accounts, invested in stocks or bonds, or used to pay down debt. Savings (S) represent a leakage from the circular flow: money that households earn but do not spend on current consumption.
If savings simply sat idle, the circular flow would shrink, and the economy would contract. But in a modern economy, savings are not idle. They are channeled through the financial sector—banks, stock markets, bond markets, and other financial institutions—and become investment (I) . Investment is spending by firms on capital goods: new factories, machinery, equipment, technology, and inventory. When a firm borrows money from a bank to build a new factory, that bank is using the deposits of savers to fund the loan. Savings, which leaked out of the flow when households did not spend, are injected back in as investment.
However, the financial sector does more than simply channel existing savings. Banks also create money through the process of lending. When a bank makes a loan, it does not hand out existing deposits; it creates a new deposit in the borrower's account. This newly created money expands the circular flow beyond what would be possible from existing savings alone. This is why the financial system can amplify both booms and busts: during good times, credit creation fuels expansion; during crises, when banks stop lending, the flow contracts sharply.
In a well-functioning economy, interest rates coordinate the flow of savings into investment. When savings are abundant relative to investment opportunities, interest rates fall, making borrowing cheaper and encouraging more investment. When investment opportunities are abundant relative to savings, interest rates rise, encouraging more saving. This coordination mechanism is essential for keeping the circular flow balanced.
However, the transformation of savings into investment is not automatic. It depends on a well-functioning financial system and on the expectations of businesses about future profitability. The 2008 financial crisis provides a powerful example of what happens when this transformation breaks down. In the years leading up to the crisis, the financial system had been channeling enormous amounts of savings into housing-related investments, many of which were based on risky subprime mortgages. When the housing bubble burst, the financial system froze. Banks stopped lending, and even creditworthy businesses found themselves unable to borrow for investment. The transformation of savings into investment, which normally keeps the circular flow moving, came to a halt. Investment collapsed, and with it, the economy went into a deep recession.
Key takeaway: The financial sector introduces savings (S) as a leakage and investment (I) as an injection. Banks not only channel savings but also create new money through lending, which can amplify economic fluctuations. The coordination of savings and investment through interest rates is critical for economic stability.
Adding the Foreign Sector – Exports, Imports, and Capital Flows
No modern economy is closed. Goods, services, and money flow across national borders. The foreign sector adds another layer to the circular flow: exports and imports. Exports (X) are goods and services produced domestically and sold to other countries. They represent an injection into the circular flow, because foreign buyers send money into the domestic economy. Imports (M) are goods and services produced in other countries and purchased by domestic households, firms, or the government. They represent a leakage, because money flows out of the domestic economy to pay for them.
But trade flows are only one part of the international story. Alongside exports and imports, there are capital flows—the movement of financial capital across borders. When a foreign investor buys a U.S. Treasury bond, a share of a U.S. company, or a piece of U.S. real estate, that is a capital inflow—an injection into the U.S. financial system. When a U.S. investor buys assets abroad, that is a capital outflow—a leakage. Crucially, a country's trade balance and its capital flows are two sides of the same coin. A country running a trade deficit (imports exceeding exports) must finance that deficit by attracting capital inflows. The United States, with its persistent trade deficit, has been the world's largest recipient of capital inflows for decades.
When a country exports more than it imports, it runs a trade surplus. In this case, injections from the foreign sector exceed leakages, adding to the overall circular flow. When a country imports more than it exports, it runs a trade deficit, and leakages exceed injections, subtracting from the flow. The foreign sector also creates connections between economies that mean events in one country can ripple through the circular flows of others. When China's economy slowed in 2015, its demand for imports from Australia, Brazil, and other commodity-exporting countries fell, reducing the injections those countries received from exports. When the United States imposed tariffs on Chinese goods in 2018 and 2019, it altered the flow of trade between the world's two largest economies, affecting businesses and workers in both countries.
Key takeaway: The foreign sector introduces exports (X) as an injection and imports (M) as a leakage. Capital flows (financial investment across borders) are the counterpart to trade flows, and together they connect national economies into a global system.
Leakages and Injections – The Complete Picture
We have now identified the three main leakages from the circular flow and the three main injections. The leakages are:
- Savings (S) : income that households set aside rather than spend on consumption.
- Taxes (T) : income that the government collects from households and firms.
- Imports (M) : spending that leaves the domestic economy to purchase foreign goods and services.
The injections are:
- Investment (I) : spending by firms on capital goods, financed through the financial sector.
- Government Spending (G) : spending by the government on goods, services, and transfer payments.
- Exports (X) : spending from abroad that enters the domestic economy.
The relationship between these leakages and injections determines whether the circular flow is expanding, contracting, or in equilibrium. When injections exceed leakages, more money is being added to the circular flow than is being withdrawn. The total flow of income expands, and the economy grows. This was the case during the post-pandemic recovery: government stimulus (G), a surge in investment (I), and a rebound in exports (X) more than offset the leakages from savings (S), taxes (T), and imports (M), driving a rapid expansion. When leakages exceed injections, more money is being withdrawn than added. The total flow of income contracts, and the economy slows or enters a recession. This was the case in late 2008, when the collapse in investment (I) and the fall in exports (X) left leakages from savings (S) and taxes (T) dominating the flow, leading to a sharp contraction.
The full circular flow can be visualized as a diagram with an inner loop showing the flow between households and firms (consumption spending and factor incomes), and an outer loop showing the flows to and from the government, the financial sector, and the foreign sector. The inner loop represents the core economic activity; the outer flows represent the ways in which money is diverted from or added to that core.
Equilibrium in the Circular Flow – Planned vs Actual Flows and the Role of Inventories
A crucial distinction in macroeconomics is the difference between planned and actual flows. Actual flows are what actually happens—the measured levels of spending, income, and output. Planned flows are what households, firms, and governments intend to do. The distinction matters because the economy can be out of equilibrium even when actual flows are balanced.
Equilibrium in the circular flow occurs when planned leakages equal planned injections. In other words, the amount of money that households intend to save, the government intends to tax, and the foreign sector intends to import exactly equals the amount that firms intend to invest, the government intends to spend, and the foreign sector intends to export. When this condition holds, the economy is stable: there is no tendency for output or income to change.
But what happens when planned leakages and planned injections are not equal? This is where inventories play a crucial role. Inventories—the stock of unsold goods held by firms—act as the economy's shock absorber. Suppose households decide to save more of their income. Planned savings increase, so planned leakages now exceed planned injections. Firms find that their sales are lower than they expected because households are spending less. Unsold goods pile up—inventories increase. This unplanned inventory accumulation is counted as investment in the national accounts (because goods produced but not sold are treated as inventory investment), so the accounting identity holds even though the economy is out of equilibrium. But firms do not want these unsold goods; they will respond by reducing production and laying off workers. Income falls. As income falls, households save less (because they have less income to save), and the gap between leakages and injections narrows. The economy moves toward a new equilibrium at a lower level of income.
This process of adjustment is how the economy responds to changes in behavior. It is why a rise in saving—which seems virtuous at the individual level—can cause a recession when it happens across the entire economy. This is the paradox of thrift, a concept we will explore more deeply in the next section.
The distinction between planned and actual flows also explains why recessions can be so persistent. Once the economy settles at a lower level of income, the new equilibrium may have high unemployment and idle factories. Without some change in behavior—an increase in investment, a government stimulus, a surge in exports—the economy will remain stuck. This is why fiscal and monetary policy are so important: they can shift the balance between planned leakages and injections, moving the economy toward a more desirable equilibrium.
Key takeaway: Equilibrium occurs when planned leakages (S + T + M) equal planned injections (I + G + X) . When they are not equal, inventories act as a buffer, and the economy adjusts through changes in output and income. This adjustment process can leave the economy at a level of income with high unemployment unless policy intervenes.
The Paradox of Thrift – When Individual Virtue Becomes Collective Vice
The paradox of thrift is one of the most important insights to emerge from the circular flow model. It states that what is rational for an individual—saving more to prepare for an uncertain future—can be irrational for the economy as a whole if everyone does it at the same time.
The Great Depression of the 1930s is the classic example. In the wake of the 1929 stock market crash, households and businesses across the United States tried to pay down debt and build up savings. Individually, this was prudent. But collectively, the surge in saving meant a collapse in consumption. With falling sales, businesses laid off workers, which reduced incomes further, which led to even more saving as people tried to protect themselves. The result was a downward spiral that pushed the unemployment rate to 25 percent and GDP down by nearly 30 percent.
A more recent example occurred during the 2008 financial crisis. In the years before the crisis, the U.S. personal savings rate had fallen to near zero. As the crisis hit and the economy collapsed, the savings rate surged to over six percent within two years. This was, again, individually rational: households were frightened and wanted to rebuild their finances. But the surge in saving meant a sharp contraction in consumption, which amplified the recession. The paradox of thrift was operating in full force.
The circular flow model reveals why this happens: saving is a leakage. When the leakage increases without a corresponding increase in investment (an injection), the total flow of income contracts. The paradox of thrift does not mean that saving is bad—in the long run, saving is essential for investment and growth. It means that when saving increases matters. In a recession, a surge in saving can make things worse; in a boom, saving provides the resources for future investment.
Key takeaway: The paradox of thrift illustrates that individual rationality can lead to collective irrationality when leakages increase without corresponding injections. Saving is essential for long-term growth but can deepen recessions if it surges when the economy is already weak.
The Multiplier – Why a Small Change Can Have a Big Effect
One of the most important insights that emerges from the circular flow model is the concept of the multiplier. The multiplier describes how a change in one part of the circular flow—an injection or a leakage—can lead to a much larger change in total income and output. The logic of the multiplier is rooted in the fact that one person's spending is another person's income.
Imagine that the government decides to spend one hundred million dollars on building a new bridge. This is an increase in government spending (G) , an injection into the circular flow. The construction company that receives the contract uses the money to pay its workers and buy materials. Those workers, now with additional income, go out and spend a portion of it—say, eighty million dollars—on groceries, rent, and entertainment. This spending becomes income for grocery store owners, landlords, and theater operators. They, in turn, spend a portion of that additional income—say, sixty-four million dollars—on their own consumption. This process continues, with each round of spending generating income that leads to further spending.
If we add up all the rounds of spending generated by the initial one hundred million dollars, we might find that total income in the economy has increased by five hundred million dollars. The multiplier in this example is five: each dollar of initial spending generated five dollars of total income.
The size of the multiplier depends on how much of each round of income is spent rather than leaked out of the circular flow through savings, taxes, or imports. The proportion of additional income that households spend on consumption is called the marginal propensity to consume (MPC) . The proportion that leaks out is the sum of the marginal propensity to save (MPS) , the marginal tax rate (t) , and the marginal propensity to import (MPM) . The multiplier can be expressed as:
Multiplier = 1 / (MPS + t + MPM)
Or equivalently, since MPC = 1 − (MPS + t + MPM):
Multiplier = 1 / (1 − MPC)
The more that leaks out in each round—the higher the MPS, the tax rate, or the MPM—the smaller the multiplier. The less that leaks out, the larger the multiplier.
Economists distinguish among different types of multipliers. The government spending multiplier measures the impact of a change in government spending. The tax multiplier measures the impact of a change in taxes; it is smaller than the government spending multiplier because a tax cut increases disposable income, but some of that increase is saved rather than spent. The balanced budget multiplier—the effect of increasing both government spending and taxes by the same amount—is positive, because government spending is fully injected while the tax increase reduces private spending by only a fraction (the MPC).
The multiplier explains why government stimulus can be so powerful during a recession. When the private sector is cutting back on spending, a relatively modest injection of government spending can, through the multiplier effect, generate a much larger increase in total income and employment. This was the logic behind the American Recovery and Reinvestment Act of 2009, the stimulus package enacted in response to the 2008 financial crisis, and behind the even larger stimulus packages during the COVID-19 pandemic.
But the multiplier also works in reverse. A decrease in spending—say, a collapse in investment or a fall in exports—can lead to a much larger contraction in total income. This is why recessions can spiral downward so quickly: an initial decline in spending leads to job losses, which reduces income, which leads to further declines in spending, and so on. The multiplier amplifies not only expansions but also contractions.
The size of the multiplier is not fixed. It varies depending on economic conditions. In normal times, when the economy is close to full employment, the multiplier tends to be smaller because there is less slack for additional spending to absorb without causing inflation. In a deep recession, when there is massive unemployment and idle capacity, the multiplier tends to be larger because additional spending can be met with increased production rather than higher prices. This is why economists debate the effectiveness of fiscal stimulus: its impact depends critically on the state of the economy when it is deployed.
Key takeaway: The multiplier measures how a change in injections or leakages is amplified as it ripples through the circular flow. Its size depends on the marginal propensity to consume (MPC) and the leakages that reduce each round of spending. The government spending multiplier is larger than the tax multiplier, and the multiplier is larger when the economy has slack to increase output without raising prices.
Short Run vs Long Run – Output Adjustment vs Price Adjustment
Throughout our discussion so far, we have focused on changes in output and income as the economy adjusts to shifts in leakages and injections. This focus on output rather than prices reflects an important assumption: we are analyzing the short run, the period in which prices are sticky and firms respond to changes in demand by adjusting production and employment.
In the short run, when an injection increases (say, a government stimulus), firms respond by increasing output. They hire more workers, factories run longer shifts, and the economy expands. Prices may rise somewhat, but the primary adjustment is through quantity.
In the long run, however, the dynamics are different. If the economy continues to operate above its potential output—if injections persistently exceed leakages—the pressure on prices builds. Workers demand higher wages, firms raise prices to cover rising costs, and inflation accelerates. In the long run, the adjustment to changes in the circular flow increasingly occurs through prices rather than output.
This distinction is crucial for understanding policy. In a recession—a short-run problem of insufficient demand—the goal is to boost output and employment. The multiplier works to amplify injections, and fiscal and monetary policy can be effective. But if the economy is already at full employment, additional injections will not increase output much; instead, they will primarily raise prices, leading to inflation. This is why policymakers must distinguish between situations where the economy has slack (unemployed resources) and situations where it is operating at capacity.
The 2021–2023 inflation surge illustrates this distinction. In the initial stages of the pandemic recovery, the economy had enormous slack: unemployment was high, and factories were running below capacity. Stimulus injections had a strong multiplier effect on output. But as the recovery progressed, the economy began to approach capacity. Continued injections—from government spending, low interest rates, and a consumption surge—ran into supply constraints. The result was not a further expansion of output but a surge in prices. The economy had moved from the short-run world of output adjustment to the long-run world of price adjustment.
Key takeaway: In the short run, changes in aggregate demand primarily affect output and employment. In the long run, they primarily affect prices. The distinction between these two time horizons is essential for understanding when stimulus is effective and when it risks causing inflation.
The Circular Flow and GDP Measurement – From Model to Numbers
The circular flow model is not just a conceptual tool; it is the foundation for how economists actually measure economic activity. Gross Domestic Product (GDP) can be calculated in three ways, each corresponding to a different part of the circular flow.
The expenditure approach adds up all the spending on final goods and services in the economy. From the circular flow, this is consumption by households (C), investment by firms (I), government spending (G), and net exports (exports minus imports, X − M):
GDP = C + I + G + (X − M)
The income approach adds up all the income earned in the production of goods and services. From the circular flow, this includes wages and salaries paid to workers, rents paid to landowners, interest paid to lenders, and profits earned by business owners. All of this income flows back to households, which then becomes the source of consumption and savings.
The output (or value-added) approach adds up the value of all goods and services produced, net of intermediate inputs. This corresponds to the real flow from firms to households.
The fact that these three approaches yield the same number is a fundamental identity of national income accounting, and it is a direct consequence of the circular flow. Every transaction that appears as spending in one part of the flow appears as income in another. Understanding the circular flow thus provides a framework for interpreting the economic data that appears in news reports and government publications.
Key takeaway: The circular flow underlies the measurement of GDP. The expenditure approach (C + I + G + X − M) , the income approach (wages + rents + interest + profits), and the output approach all represent different ways of measuring the same circular flow.
Real-World Applications
The circular flow model is not just an abstract diagram; it is a framework that helps us understand real-world events. Let us examine four moments in recent economic history through the lens of the model.
The Great Depression (1929–1939) —The Great Depression is the classic example of a collapse in the circular flow. A stock market crash wiped out wealth and shattered confidence. Households, terrified, increased their savings (S) dramatically—a surge in a leakage. Investment (I) collapsed as businesses saw no reason to expand. Government at the time did little to offset these changes; fiscal policy was not yet understood as a tool for stabilization. The result was a catastrophic contraction in the circular flow, with GDP falling by nearly 30 percent and unemployment reaching 25 percent. The paradox of thrift operated in full force: individual efforts to save made everyone worse off.
The 2008 Financial Crisis —The crisis began with a collapse in investment (I). As the housing bubble burst and the financial system froze, businesses stopped building new factories, buying new equipment, and investing in inventory. This was a sharp decrease in an injection. At the same time, households, frightened by the loss of wealth and uncertainty about the future, increased their savings (S)—an increase in a leakage. With injections falling and leakages rising, the gap between planned leakages and planned injections widened dramatically. The economy adjusted through a sharp contraction in output and income. The government responded with the American Recovery and Reinvestment Act of 2009—increasing government spending (G) and cutting taxes (reducing the leakage T). The Federal Reserve also lowered interest rates to encourage investment (I). The multiplier amplified these policy injections, helping to stabilize the economy and eventually restore growth.
The Eurozone Debt Crisis (2010–2015) —This crisis illustrates the multiplier in reverse. In the wake of the 2008 crisis, several Eurozone countries—Greece, Spain, Ireland, Portugal—faced soaring government debt. In response, they implemented austerity policies: sharp cuts in government spending (G) and increases in taxes (reducing the leakage T). From a circular flow perspective, these policies were major reductions in injections and increases in leakages. The result was a deep and prolonged recession in these countries. Greece's GDP fell by over 25 percent from its pre-crisis peak, and unemployment soared to over 25 percent. The multiplier had amplified the contraction: each euro of spending cuts led to a much larger fall in output. The crisis showed that the multiplier can be large when the economy is already weak and when many countries are cutting spending simultaneously.
The COVID-19 Pandemic (2020–2021) —In early 2020, the economy was hit by a sudden and massive shock. Lockdowns and fear of infection caused consumption to collapse, which represented a shift from consumption to savings (S)—an increase in a leakage. Investment (I) collapsed as businesses canceled plans. Exports (X) fell as global trade ground to a halt. Leakages surged, and injections plummeted. The government responded with an unprecedented fiscal intervention: direct stimulus payments to households, expanded unemployment benefits (both increases in government spending, G), loans and grants to businesses, and increased spending on public health. These were massive injections into the circular flow. The Federal Reserve also cut interest rates to near zero and took extraordinary steps to keep credit flowing. The multiplier worked in reverse initially—the collapse in spending was amplified into a sharp contraction—but then worked in the positive direction as the stimulus injections took hold, leading to a rapid recovery.
The 2021–2023 Inflation Surge —As the economy recovered from the pandemic, the circular flow shifted dramatically. The injections that had sustained the economy through the crisis—government stimulus (G), low interest rates (which boosted investment, I)—remained in place even as private sector spending surged. Households, flush with savings accumulated during the lockdowns, began spending heavily. Investment (I) boomed as businesses rushed to meet demand. Exports (X) also recovered. Injections now far exceeded leakages, and the circular flow expanded rapidly. In the short run, this expansion boosted output and employment. But as the economy approached capacity, continued injections began to translate into price increases rather than further output growth. The economy moved from the short-run world of output adjustment to the long-run world of price adjustment. The Federal Reserve responded by raising interest rates, which reduced investment (I)—a decrease in an injection—and encouraged saving (S)—an increase in a leakage—bringing the circular flow back toward balance and reducing inflationary pressures.
Sustainability – Beyond the Circular Flow
The circular flow model, as traditionally presented, assumes that resources are unlimited and that the environment is simply a backdrop to economic activity. But in the twenty-first century, this assumption is increasingly untenable. The real economy operates within a biophysical environment: it extracts resources from nature and returns waste to it. The circular flow of money is not a closed loop in the physical sense; it is an open system drawing on finite resources.
This has led to the development of ecological economics, which emphasizes that the economy is a subsystem of the environment, not the other way around. Climate change, resource depletion, and pollution are not external to the circular flow; they are consequences of it. Policies like carbon taxes can be understood within the circular flow framework: they increase the price of carbon-intensive goods, which affects consumption patterns and can redirect investment toward cleaner technologies.
Acknowledging this dimension does not invalidate the circular flow model—it enriches it. It reminds us that the flow of money is not an end in itself but a means to human well-being, and that well-being depends on a stable and healthy environment. As you continue your study of macroeconomics, you will encounter debates about how to incorporate these environmental realities into the models that guide policy.
Conclusion: The Flow That Connects Everything
The circular flow model reveals a simple but profound truth: an economy is not a collection of separate activities but a single, interconnected system in which every transaction is connected to every other transaction. When a worker loses a job, that is not just a personal tragedy; it is a reduction in the flow of income that will reduce spending somewhere else. When a business invests in a new factory, that is not just a corporate decision; it is an injection that will create income for workers, suppliers, and communities. When a government sends out stimulus checks, it is not just a transfer of money; it is an attempt to keep the flow moving when private spending has stalled.
Understanding the circular flow helps us see why economies sometimes get stuck in recessions and how they can be unstuck. It explains why the 2008 financial crisis was so severe: the breakdown in the financial system meant that savings could not be transformed into investment, leaving a gap between planned leakages and injections that dragged the economy down. It explains why the pandemic recession was so deep but short: massive government injections offset the collapse in private spending, keeping the flow moving until the private sector could recover. It explains why the Eurozone crisis was so prolonged: austerity policies reduced injections and deepened the contraction. And it explains why inflation surged in 2021 and 2022: the flow of spending simply overwhelmed the economy's capacity to produce.
The circular flow is not a complicated model, but it is a profound one. It reveals that an economy is not a collection of separate activities but a single, interconnected system. It shows that what happens in one part of the system inevitably affects all the others. And it provides a framework for thinking about how policy can stabilize the system when it goes off course. To understand the circular flow is to understand the basic architecture of economic life—the flow of money and resources that connects households, firms, governments, and nations in a continuous, dynamic, and sometimes fragile dance. It is the foundation upon which the rest of macroeconomics is built, and mastering it is the first step toward a deeper understanding of how economies work, why they fail, and how they can be made to work better.
About Swati Sharma
Lead Editor at MyEyze, Economist & Finance Research WriterSwati Sharma is an economist with a Bachelor’s degree in Economics (Honours), CIPD Level 5 certification, and an MBA, and over 18 years of experience across management consulting, investment, and technology organizations. She specializes in research-driven financial education, focusing on economics, markets, and investor behavior, with a passion for making complex financial concepts clear, accurate, and accessible to a broad audience.
Disclaimer
This article is for educational purposes only and should not be interpreted as financial advice. Readers should consult a qualified financial professional before making investment decisions. Assistance from AI-powered generative tools was taken to format and improve language flow. While we strive for accuracy, this content may contain errors or omissions and should be independently verified.