Tutorial Categories
Last Updated: June 2, 2026 at 10:30
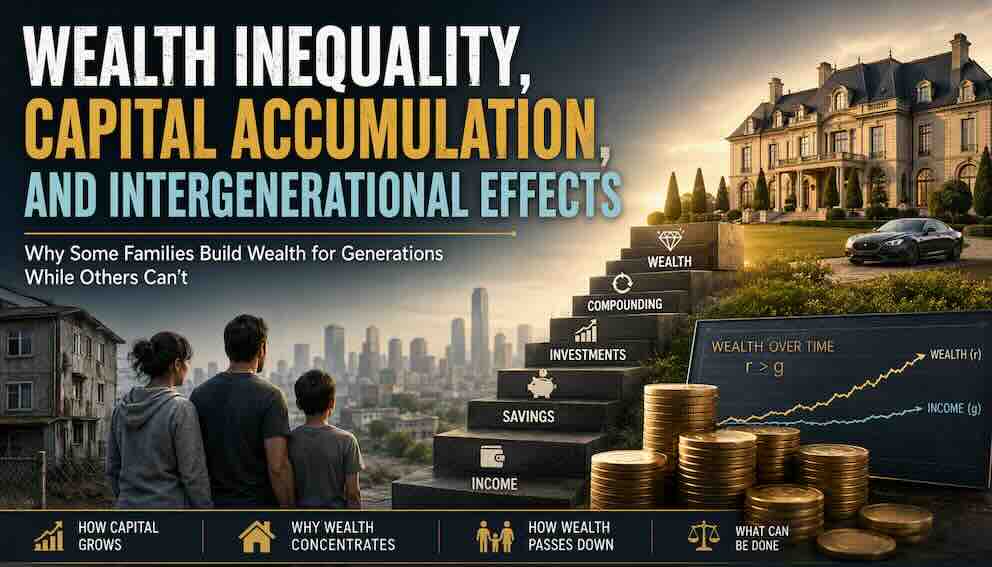
Wealth Inequality, Capital Accumulation, and Intergenerational Effects: Understanding Why Some Families Build Wealth While Others Cannot
How Capital Grows, Concentrates, and Passes from One Generation to the Next
Why do some families accumulate wealth that lasts for generations while others struggle to save anything at all? This tutorial explores the macroeconomic forces behind wealth inequality, focusing on how capital accumulation shapes the distribution of assets over time. Drawing on the work of economists like Thomas Piketty, it explains why the return on capital often exceeds economic growth (r > g), why wealthy investors often earn higher returns than middle-class savers, and how inheritance is making a comeback in rich countries. Using real-world examples from the United States, Germany, Japan, Norway, and the United Kingdom, it shows how housing markets, asset price inflation, and monetary policy have reshaped wealth inequality since 2008. By the end, you will understand the deep structural forces that make wealth beget more wealth, and what might be done about it. Note: This tutorial builds on the Income Inequality tutorial in this series. Wealth inequality is different from income inequality, and understanding both is essential for a complete picture of economic disparity. The labour versus capital income share is covered in a separate tutorial.
Introduction: Two Families, Two Fortunes
Imagine two families living in the same city. Both have similar household incomes of about seventy thousand pounds a year. Both work full time. On the surface, they seem economically similar.
But there is a crucial difference. The first family inherited a house from their parents in a neighbourhood that has gentrified over the past twenty years. They have no mortgage. They have built up savings in investment accounts. When unexpected expenses arise, they have resources to draw upon.
The second family rents their home. They have no inherited assets. They have modest savings, but a medical emergency or a job loss could wipe them out. They are one setback away from financial distress.
These two families have the same income, but their wealth is vastly different. The first family has security, options, and the ability to pass advantages to their children. The second family lives with constant financial vulnerability.
This is the difference that wealth inequality makes. It is not captured by looking at income alone. Wealth inequality is deeper, more persistent, and harder to change. This tutorial explains why.
What Is Wealth Inequality?
Wealth inequality refers to the unequal distribution of assets among individuals or households in an economy. Assets include property, savings, stocks, bonds, business ownership, and any other store of value. Debts are subtracted, so wealth can be negative for households with more liabilities than assets.
As covered in the Income Inequality tutorial, income is the flow of earnings over time. Wealth is the stock of accumulated assets. The two are related because higher incomes make it easier to save and invest, but they are not the same.
Consider two households. One has modest income but owns a home outright and has retirement savings. Another has high income but carries large student debts and has not yet built savings. The first has higher wealth but lower income. The second has higher income but lower wealth.
Real-world data shows that wealth is far more concentrated than income. In the United States, the top ten percent of households own roughly two-thirds of all wealth, while the bottom fifty percent own less than two percent. In the United Kingdom, the wealthiest ten percent own nearly half of all wealth. In Germany, the concentration is similar.
These patterns emerge from deep structural forces that this tutorial explores.
The Engine: How Capital Accumulation Works
Capital accumulation is the process of building up assets over time through saving and investment. One of the central insights from the Solow Growth Model in this series is that capital accumulation drives economic growth at the aggregate level. The same logic applies to households.
When a household saves and invests, that investment typically earns a return. If the returns are reinvested, wealth grows through compounding. The longer the time horizon, the more powerful compounding becomes.
Consider a person who invests ten thousand pounds at age twenty-five and earns a five percent annual return. By age sixty-five, without adding another penny, they will have about seventy thousand pounds. The same person who starts at age forty-five will have only about twenty-six thousand pounds. Starting earlier makes an enormous difference.
This is why wealth inequality can emerge even among people with similar incomes. Those who start saving earlier, or who receive gifts or inheritances that allow them to start sooner, benefit from a longer compounding period.
The Ramsey-Cass-Koopmans model from this series showed that patient households save more and build more capital. This tutorial extends that logic to show how differences in starting points, not just patience, create persistent gaps.
A household that cannot save at all because their income barely covers living expenses never enters the compounding game. Their wealth remains near zero. Over decades, the gap widens dramatically.
Piketty's Insight: r > g
The French economist Thomas Piketty, in his landmark book Capital in the Twenty-First Century, identified a simple but powerful inequality that drives wealth concentration:
r > g
Here, r is the average return on capital — the rate at which wealth grows through investment returns. g is the growth rate of the economy — the rate at which wages and overall national income grow.
When r exceeds g, people who already own assets see their wealth grow faster than typical wages. Wealth that is already accumulated outpaces the economy as a whole. Over time, wealth concentrates at the top.
Consider historical data from the United States. Over the past century, the return on capital (r) has averaged about four to five percent per year after inflation for a diversified portfolio of stocks. The growth rate of the economy (g) has averaged about two to three percent per year.
The gap between r and g might seem small — just one or two percentage points. But over decades, compounding makes this gap enormous. A one percent difference over fifty years means wealth grows about sixty-five percent more than income.
Piketty documented that high levels of wealth concentration in the nineteenth century, during the Gilded Age, were driven by r >> g. The mid-twentieth century was unusual because wars, inflation, high taxes, and low growth temporarily compressed wealth inequality. Since 1980, r has again exceeded g in most rich countries, and wealth inequality has risen.
Why Returns Are Not Equal for Everyone
The inequality r > g is important, but returns on capital are not the same for everyone.
A wealthy family with millions of pounds has access to investment opportunities that a middle-class family does not. They can hire professional fund managers, invest in private equity, participate in venture capital, and access hedge funds. Top-tier private equity funds have historically generated net returns of about ten to twelve percent annually, though the advantage over public markets narrows once fees and illiquidity are accounted for.
A middle-class family with modest savings might have access only to basic savings accounts, certificates of deposit, or mutual funds. These investments typically generate much lower returns — often one to three percent after inflation.
This means the rich not only have more capital but often earn a higher rate of return on that capital. This is called return heterogeneity, and it amplifies wealth inequality beyond what r > g alone predicts.
A wealthy investor with ten million pounds earning ten percent annually grows their wealth by one million pounds per year. A middle-class saver with fifty thousand pounds earning one percent grows their wealth by five hundred pounds annually. The gap widens because the wealthy have more capital and their capital works harder.
Housing Wealth: The Silent Driver of Inequality
In countries like the United Kingdom, Australia, and Canada, housing appreciation has been the single largest driver of wealth inequality over the past thirty years.
Consider two people who bought similar houses in London in 1995. One paid one hundred thousand pounds. Today, that house might be worth six hundred thousand pounds or more. That five hundred thousand pound gain did not come from increased productivity or additional work. It was passive windfall from being in the right place at the right time.
Someone who could not afford to buy in 1995, or who was too young, or who lacked family help for a deposit, missed out entirely. They have been paying rent for thirty years while watching homeowners get richer.
This dynamic creates a sharp divide between those who entered the housing market early and those who did not. In the United Kingdom, homeownership rates among young adults have fallen sharply. In 1990, about two-thirds of twenty-five to thirty-four year olds owned their home. Today, less than half do.
The same pattern appears in Australia, where housing prices in Sydney and Melbourne have soared, and in Canada, where Toronto and Vancouver have seen similar appreciation. In each case, the wealth gap between homeowners and renters has widened dramatically.
Parents who own homes can help their children with deposits, giving them a foothold. Renters cannot. The cycle continues.
Asset Price Inflation and Monetary Policy Since 2008
One of the most important drivers of wealth inequality in recent years is the role of central bank policy.
After the 2008 financial crisis, central banks around the world lowered interest rates to near zero and engaged in quantitative easing — buying government bonds and other assets to inject money into the economy. These policies successfully prevented a depression. But they also had an unintended side effect.
Lower interest rates make future returns more valuable and borrowing cheaper, which pushes up the prices of assets: stocks, bonds, and property. People who already owned these assets saw their wealth rise. People who did not own them saw nothing.
From 2009 to 2021, the S&P 500 index in the United States more than quadrupled. Housing prices in many countries rose by fifty to one hundred percent. These gains flowed disproportionately to the wealthiest households, who own the majority of financial assets and investment properties.
The bottom half of households own very few financial assets. Their wealth is concentrated in housing if they own a home, or in nothing if they rent. The post-2008 asset price boom therefore passed them by.
This is not a criticism of central bank policy. Quantitative easing likely prevented a much deeper crisis. But it is an example of how macroeconomic policy choices have distributional consequences. The wealthy benefit more from asset price inflation because they own more assets.
The Racial Wealth Gap
Wealth inequality in many countries is not race-blind. In the United States, the gap between white households and Black households is staggering.
The median white household has about one hundred and eighty-eight thousand dollars in wealth. The median Black household has about twenty-four thousand dollars. The gap is roughly eight to one. For Hispanic households, the median is about thirty-six thousand dollars.
This gap is not explained by income differences alone. Black households with the same income as white households still have substantially less wealth. The reasons are historical and structural.
Generations of discrimination in housing markets prevented Black families from building home equity. The GI Bill, while race-neutral in its text, was administered locally in ways that systematically excluded Black veterans. Banks refused to make loans in Black neighbourhoods — a practice called redlining. Universities admitted few Black students. The legacy of slavery and Jim Crow meant that Black families had little wealth to pass down through inheritance.
Even today, Black families are more likely to be renters rather than homeowners. They are more likely to have student debt. They are less likely to receive large inheritances. Each of these factors compounds over generations.
Similar patterns exist in other countries. In South Africa, the legacy of apartheid created enormous racial wealth disparities. In the United Kingdom, Pakistani and Bangladeshi households have substantially less wealth than white British households.
Wealth inequality is not just about economics. It is about history, discrimination, and cumulative disadvantage passed down through generations.
The Gender Wealth Gap
Women typically have less wealth than men. The gap varies across countries, but it is present everywhere.
Women earn less than men over their lifetimes due to the gender wage gap. They are more likely to work part-time or take career breaks for caregiving. They live longer, meaning their retirement savings must stretch further. They are less likely to own property or businesses.
In many countries, women also face barriers to inheriting wealth. Cultural norms in some societies direct inheritance to sons rather than daughters. Married women in some legal systems have limited control over property.
The gender wealth gap narrows but does not disappear when controlling for income. Structural factors beyond earnings affect women's ability to accumulate wealth.
How Wealth Transfers Across Generations
One of the most powerful drivers of wealth inequality is the ability to pass assets from parents to children. Intergenerational transfers come in three forms: inheritances, gifts during life, and investments in children's education and opportunities.
Inheritance used to be less important than it is today. The mid-twentieth century saw a decline in inherited wealth due to two world wars, the Great Depression, inflation that eroded asset values, and high inheritance taxes. But inheritance is making a comeback.
Piketty's data shows that in France, inherited wealth accounted for about forty percent of total wealth in 1970. By 2020, it had risen to over sixty percent. Similar trends are visible in the United Kingdom, Germany, and the United States.
The post-war generations accumulated substantial wealth, and they are now passing it to their children. The baby boomers in many rich countries are the wealthiest generation in history. As they age, they are transferring trillions of pounds.
This creates a self-reinforcing cycle. Wealthy parents give large inheritances. Those children invest that wealth, watch it grow, and pass even larger inheritances to their children. Families without wealth to pass on are locked out.
Intergenerational transfers go beyond direct inheritance. Wealthy parents can afford better schools, tutors, university tuition, and housing down payments. They can cover internships that allow their children to work for low pay while building careers. They can provide safety nets that allow risk-taking.
A child born to a wealthy family has a higher probability of becoming wealthy themselves, regardless of their own abilities or effort. This is intergenerational persistence.
Productive Versus Rentier Wealth
Not all wealth is the same. Economically, it matters how wealth is created and maintained.
Productive wealth is invested in businesses, factories, technology, and innovation. It creates jobs, generates output, and contributes to economic growth. A founder who builds a company that employs thousands of people has created productive wealth.
Rentier wealth derives from owning scarce assets and collecting income without adding productive value. Owning land and charging rising rents, owning a patent and charging monopoly prices, owning a taxi medallion and collecting fees — these are forms of rent-seeking. The wealth grows because the asset is scarce, not because the owner is productive.
This distinction matters for policy. A high tax on productive capital might discourage investment and job creation. A high tax on unearned rents might have little negative economic effect while reducing inequality.
The rise of wealth inequality is driven partly by a return to rentier capitalism, where inherited wealth and asset scarcity matter more than entrepreneurial innovation. Housing wealth, in particular, is often closer to rentier wealth. A homeowner who has not necessarily created new economic output but watched their property appreciate has captured windfall gains.
A Different Model: Sovereign Wealth and Collective Ownership
Most discussions focus on individual ownership. But there is another model: collective ownership through sovereign wealth funds.
Norway provides the clearest example. Norway discovered oil in the North Sea in the 1970s. Instead of allowing the oil wealth to be captured by a few individuals or corporations, the government created the Government Pension Fund Global — the world's largest sovereign wealth fund. Today, the fund is worth over one trillion pounds. Every Norwegian citizen has a stake in it.
The fund is invested globally in stocks, bonds, and real estate. Its returns flow into the national budget, funding public services, pensions, and infrastructure. Because the wealth is owned collectively, it does not contribute to individual wealth inequality.
Sovereign wealth funds are not a solution for every country. They require significant natural resource wealth or sustained fiscal surpluses. But they demonstrate that ownership structure matters. Wealth can be held collectively.
Other countries have experimented with similar models. Alaska's Permanent Fund distributes oil revenue to every resident as a dividend. Singapore's Temasek Holdings is a state-owned investment company.
Historical Patterns: The Great Compression and the Return of Wealth
Wealth inequality has not moved in a straight line. It has risen and fallen dramatically.
In the late nineteenth and early twentieth centuries, wealth inequality was extremely high. This was the Gilded Age, when industrial barons like John D. Rockefeller and Andrew Carnegie amassed fortunes worth hundreds of billions today. The top one percent owned a majority of wealth in the United States and Europe.
Then came the Great Compression, roughly from 1940 to 1970. Two world wars destroyed physical capital. Inflation eroded financial assets. High taxes on top incomes and estates redistributed resources. Labour unions grew strong. The middle class expanded. Wealth inequality fell to its lowest levels.
Since 1980, the trend has reversed. Financial deregulation, lower taxes on top incomes and capital gains, the rise of global financial markets, and wage stagnation have all contributed to rising wealth inequality. The top one percent has regained much of the ground lost during the mid-century.
Since 2008, monetary policy has added a new force. Quantitative easing and low interest rates inflated asset prices, further benefiting those who already owned assets. The recovery from the financial crisis was a wealth recovery for the top.
Wealth inequality is not inevitable. It is shaped by policies, institutions, wars, and social movements. What rose can be reduced.
What Has Actually Worked? Policy and Evidence
High inheritance and estate taxes have been effective where implemented. The United States had high estate taxes in the mid-twentieth century, contributing to the Great Compression. Those taxes have since been lowered, and wealth concentration has risen. Japan and Germany have maintained relatively high inheritance taxes and have more equal wealth distributions.
Germany took a distinctive path on housing: rent control and strong tenant protections made renting a stable, long-term option. Housing prices remained moderate. Wealth inequality stayed lower than in countries that encouraged homeowners to treat property as an investment.
Post-war asset reforms made a lasting difference. Japan's land reforms after World War II broke up large estates and redistributed land to tenant farmers. South Korea and Taiwan did the same. These reforms created broad asset ownership for decades.
Sovereign wealth funds, as in Norway, offer a model of collective ownership that prevents wealth concentration. Not every country has oil, but the principle — that natural resource wealth belongs to all citizens — could be extended.
What has not worked? Moderate wealth taxes have been tried in several European countries, including France, Germany, and Sweden. Most have been repealed due to high administrative costs, difficulty valuing assets, capital flight, and modest revenue. However, high inheritance taxes have proven more durable.
The Labour-to-Capital Shift
One final force shaping wealth inequality is the shift in national income from labour to capital. Since 1980, the share of income going to wages has fallen in many rich countries, while the share going to profits, dividends, rent, and capital gains has risen.
This matters because capital income flows disproportionately to those who already own assets. When the capital share rises, the wealthy benefit twice: they earn more from their existing capital, and they have more income to save and invest further, compounding their advantage.
This dynamic — sometimes called the functional distribution of income — is covered in depth in a later tutorial in this series. For now, the key takeaway is that wealth inequality is not only about how capital is distributed, but also about how much of national income accrues to capital rather than labour.
Conclusion: Why Wealth Inequality Is Different
Wealth inequality is not simply a more extreme version of income inequality. It is different in kind.
Wealth compounds. A high-income earner who spends most of their income will never build substantial wealth. A low-income earner who inherits a house can be wealthy. This decoupling means wealth inequality can persist even when income inequality is reduced.
The rich not only have more capital but often earn higher returns on that capital. This feedback loop pushes wealth toward the top.
Inheritance is making a comeback, passing advantages from the past into the future. Families without wealth to pass on are locked out.
Housing markets and monetary policy have reshaped wealth inequality. The post-2008 asset price boom benefited those who already owned assets, widening gaps between owners and renters, old and young, those with family help and those without.
History shows wealth inequality is not immutable. The Great Compression proves that policies and events can dramatically reduce it. Its return proves those gains can be undone.
Wealth is not just a store of value. It is a source of power, security, and opportunity. When concentrated in too few hands, democratic foundations strain. When broadly shared, the economy is more resilient.
The question is not whether some inequality should exist. It is whether the current level is compatible with the kind of society we want. That is a question for all citizens.
About Swati Sharma
Lead Editor at MyEyze, Economist & Finance Research WriterSwati Sharma is an economist with a Bachelor’s degree in Economics (Honours), CIPD Level 5 certification, and an MBA, and over 18 years of experience across management consulting, investment, and technology organizations. She specializes in research-driven financial education, focusing on economics, markets, and investor behavior, with a passion for making complex financial concepts clear, accurate, and accessible to a broad audience.
Disclaimer
This article is for educational purposes only and should not be interpreted as financial advice. Readers should consult a qualified financial professional before making investment decisions. Assistance from AI-powered generative tools was taken to format and improve language flow. While we strive for accuracy, this content may contain errors or omissions and should be independently verified.