Tutorial Categories
Last Updated: April 18, 2026 at 10:30
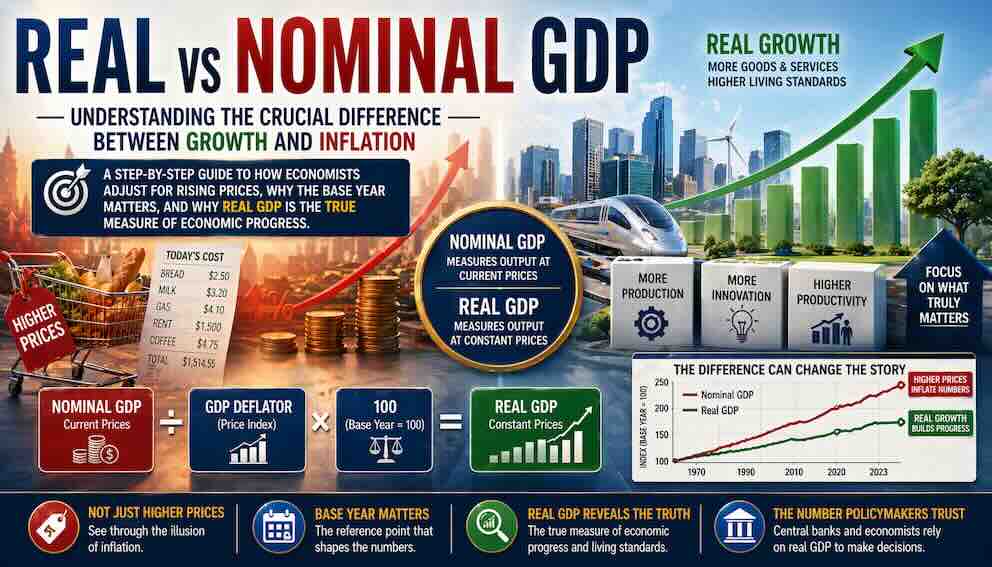
Real vs Nominal GDP: Understanding the Crucial Difference Between Growth and Inflation
A Step-by-Step Guide to How Economists Adjust for Rising Prices, Why the Base Year Matters, and Why Real GDP Is the True Measure of Economic Progress
This tutorial explains one of the most important distinctions in macroeconomics: the difference between nominal GDP and real GDP. You will learn why nominal GDP—which measures output at current prices—can be deeply misleading during periods of inflation, and how real GDP solves this problem by adjusting for price changes using a base year. We will walk through the concept of the GDP deflator, explore how to calculate real growth rates, and understand why a small difference in inflation adjustment can completely change our understanding of whether an economy is truly expanding or just experiencing rising prices. Using real-world examples from the 1970s stagflation, the 2008 financial crisis, and the 2021–2023 inflation surge, this tutorial shows why real GDP is the measure economists rely on to understand genuine economic progress.
Introduction: The Illusion of Rising Numbers
Imagine you have a job that pays you $50,000 a year. One year later, your boss calls you into the office and says, "Congratulations! Your salary is now $55,000—a 10 percent raise." You are thrilled. But then you look at your bank account and realize that everything you buy—groceries, rent, gasoline—has also gone up in price by 10 percent. In real terms, you are no better off than you were before. Your nominal salary went up, but your purchasing power stayed exactly the same.
This is exactly the problem economists face when they look at GDP. Nominal GDP—the value of everything a country produces measured at current prices—can rise for two reasons. Either the country is producing more goods and services (real growth), or the prices of those goods and services have gone up (inflation). When you read that "GDP grew by 5 percent last year," you cannot tell whether that growth represents genuine economic expansion or simply rising prices. And during periods of high inflation, the difference can be enormous.
This is why economists developed the concept of real GDP. Real GDP adjusts for inflation by measuring output using constant prices from a chosen base year. It strips away the effects of price changes to reveal what is truly happening to the quantity of goods and services the economy is producing. Real GDP is the measure that tells us whether the economy is genuinely growing or merely experiencing rising prices. It is the number that central bankers watch, the figure that determines whether a country is in recession, and the yardstick by which we compare living standards across time.
In this tutorial, we will explore the distinction between nominal and real GDP in depth. We will learn how economists adjust for inflation using the GDP deflator, what it means to choose a base year, and how to calculate real growth rates. We will walk through real-world examples—the stagflation of the 1970s, the financial crisis of 2008, and the inflation surge of 2021–2023—to see why this distinction matters so much. By the end, you will understand why economists almost always talk about real GDP when they discuss economic growth, and why nominal GDP can be deeply misleading if you do not know how to read it.
The Basic Distinction – What Nominal and Real GDP Actually Mean
Let us start with a simple definition. Nominal GDP is the total market value of all final goods and services produced within a country's borders, measured using the prices that prevailed at the time of production. It is sometimes called "current-dollar GDP" because it reflects the prices actually paid in the marketplace during that period. If prices rise, nominal GDP rises even if the quantity of goods produced stays exactly the same.
Real GDP is the total market value of all final goods and services produced within a country's borders, measured using constant prices from a chosen base year. By holding prices fixed, real GDP isolates changes in the quantity of output. When real GDP rises, we know that the economy is actually producing more goods and services—not just experiencing price increases.
To understand why this distinction matters, consider a very simple economy that produces only one thing: bread. In Year 1, this economy produces 100 loaves of bread, and each loaf sells for $2. Nominal GDP is $200. In Year 2, the economy produces the same 100 loaves of bread, but now each loaf sells for $3 because of inflation. Nominal GDP is $300—a 50 percent increase. But has the economy grown? No. It is producing exactly the same amount of bread. The increase in nominal GDP is entirely due to inflation.
Now suppose in Year 3, the economy produces 110 loaves of bread, and the price rises again to $3.50. Nominal GDP is $385. How much of that increase is due to more bread, and how much is due to higher prices? Without adjusting for inflation, we cannot tell. Real GDP solves this problem by measuring both Year 2 and Year 3 output using Year 1 prices. At Year 1 prices of $2 per loaf, Year 2 real GDP is $200 (100 loaves times $2), and Year 3 real GDP is $220 (110 loaves times $2). The increase from $200 to $220 is a 10 percent increase in real GDP—the true growth in output. The remaining increase in nominal GDP is accounted for by rising prices.
This simple example captures the essence of the problem. In the real world, the economy produces thousands of different goods and services, and prices change at different rates. The challenge of calculating real GDP is to aggregate all these different products into a single measure that reflects changes in quantity, not prices. The tool economists use to do this is the GDP deflator.
Key takeaway: Nominal GDP measures output at current prices; real GDP measures output at constant prices from a base year. Real GDP strips away the effects of inflation to reveal whether the economy is actually producing more goods and services.
The GDP Deflator – The Tool That Separates Quantity from Price
The GDP deflator is the price index that economists use to convert nominal GDP into real GDP. It measures the average price level of all goods and services included in GDP, relative to a base year. The formula is simple:
GDP Deflator = (Nominal GDP / Real GDP) × 100
For the base year—the year we choose as the reference point—nominal GDP and real GDP are the same, so the deflator is 100. In subsequent years, if prices have risen on average, the deflator will be greater than 100. If prices have fallen (deflation), the deflator will be less than 100.
To convert nominal GDP to real GDP, we rearrange the formula:
Real GDP = (Nominal GDP / GDP Deflator) × 100
Let us return to our bread economy example. If we choose Year 1 as the base year, then in Year 1, nominal GDP is $200 and real GDP is $200, so the deflator is 100. In Year 2, nominal GDP is $300, but we know real GDP is still $200 (because output is unchanged). Plugging into the formula: ($300 / $200) × 100 = 150. The deflator of 150 tells us that prices have risen by 50 percent on average since the base year. In Year 3, nominal GDP is $385, and real GDP is $220. The deflator is ($385 / $220) × 100 = 175. This tells us that prices have risen by 75 percent since the base year.
Now suppose we want to calculate the inflation rate between Year 2 and Year 3. Using the deflator, the inflation rate is (175 − 150) / 150 × 100 = 16.7 percent. This is the rate at which prices rose on average across the entire economy during that period. Notice that this inflation rate is not the same as the price increase of bread alone, which went from $3 to $3.50—a 16.7 percent increase. In this simple economy, they happen to be the same because bread is the only good. In the real world, the GDP deflator is a weighted average of price changes across thousands of different goods and services.
The GDP deflator differs from the Consumer Price Index (CPI) in an important way. The CPI measures price changes from the perspective of households, using a fixed basket of consumer goods. The GDP deflator measures price changes across all domestically produced goods and services—including investment goods, government purchases, and exports. This makes the GDP deflator a broader measure of inflation than the CPI. When the prices of imported goods rise, the CPI goes up, but the GDP deflator does not, because those imports were not produced domestically. We will explore the differences between these two inflation measures in a later tutorial.
Key takeaway: The GDP deflator is the price index that converts nominal GDP into real GDP. It measures the average price level of all domestically produced goods and services. A deflator of 150 means prices have risen 50 percent since the base year.
The Base Year – Choosing a Reference Point
The base year is the year whose prices are used to value output when calculating real GDP. Choosing the base year is like choosing a reference point on a map—it does not change the underlying terrain, but it affects how we describe distances. In the United States, the Bureau of Economic Analysis currently uses 2017 as the base year for its real GDP calculations, but it updates this periodically to reflect changes in the structure of the economy.
Why does the base year matter? Because relative prices change over time. The price of computers has fallen dramatically over the past thirty years, while the price of healthcare has risen sharply. If we use a base year from the 1990s, we will give more weight to computers than they actually have in today's economy. If we use a more recent base year, the weights reflect current spending patterns. This is why statistical agencies periodically update the base year to keep real GDP measures relevant.
To understand this, imagine an economy that produces two goods: computers and healthcare. In 1990, computers were expensive and healthcare was relatively cheap. In 2020, computers are much cheaper and healthcare is much more expensive. If we use 1990 prices to value output in 2020, we will overstate the importance of computers (because their 1990 price is high) and understate the importance of healthcare (because its 1990 price is low). The result is a real GDP measure that does not accurately reflect the actual composition of output. By updating the base year, statisticians ensure that the weights used to aggregate different goods reflect the economy as it actually is.
The choice of base year also affects the calculated growth rates. If relative prices are changing rapidly, the growth rate of real GDP can differ depending on which base year is used. This is why the Bureau of Economic Analysis in the United States uses a technique called chained dollars—it updates the base year every year, effectively using an average of adjacent years' prices to calculate growth rates. This approach, known as chain-weighted GDP, provides a more accurate picture of growth than using a single fixed base year. When you see "real GDP in chained 2017 dollars," this is what it means: the base year is 2017, but the growth rates are calculated using a chain of price weights that update each year.
Key takeaway: The base year is the year whose prices are used to value output in real GDP calculations. Statistical agencies periodically update the base year to reflect changes in relative prices and the structure of the economy. In the United States, the Bureau of Economic Analysis uses chain-weighted GDP, which effectively updates the base year each year for more accurate growth measurement.
Real Growth vs Price Effects – Separating the Two Stories
One of the most valuable insights from real GDP is that it allows us to decompose nominal GDP growth into two components: growth in the quantity of goods and services (real growth) and growth in the price level (inflation). This decomposition is not just an accounting exercise; it tells us two very different stories about what is happening in the economy.
Consider the 1970s, a decade of high inflation in the United States. Between 1970 and 1980, nominal GDP grew by about 160 percent. That sounds like an enormous expansion. But when we adjust for inflation, real GDP grew by only about 30 percent over the same period. The remaining 130 percentage points of nominal growth were simply price increases. The economy was not booming in the way the nominal numbers suggested; it was experiencing stagflation—a combination of slow growth and high inflation. This is a classic example of why nominal GDP can be deeply misleading.
Now consider the period from 2009 to 2020, following the financial crisis. Nominal GDP grew steadily, but inflation was very low. Real GDP growth was only slightly lower than nominal growth. In this case, the nominal numbers were a reasonably accurate reflection of real growth because price effects were small. During the COVID-19 pandemic, the pattern was different again. In 2020, nominal GDP fell, and real GDP fell even more because prices were also falling slightly (deflation). In 2021, nominal GDP surged as the economy reopened, but real GDP also surged because inflation had not yet taken off. By 2022, however, the gap between nominal and real GDP widened dramatically as inflation spiked. Nominal GDP growth was over 9 percent, but real GDP growth was only about 2 percent—most of the nominal growth was simply rising prices.
This decomposition matters for policy. When a central bank looks at GDP, it needs to know whether growth is real or just inflation. If nominal GDP is growing but real GDP is flat, the economy is not actually expanding—it is just experiencing rising prices. In that case, the central bank might need to raise interest rates to cool inflation, even though the nominal numbers look strong. If real GDP is growing strongly, the central bank might be more tolerant of modest inflation. The distinction between real growth and price effects is at the heart of monetary policy.
Key takeaway: Real GDP allows us to decompose nominal GDP growth into real growth (changes in quantity) and inflation (changes in prices). During the 1970s, nominal GDP growth was high but real growth was low—stagflation. During the 2021–2023 period, nominal GDP surged, but most of it was inflation. Understanding the difference is essential for interpreting economic conditions and policy responses.
Why Real GDP Matters – What It Tells Us That Nominal GDP Cannot
Real GDP is the measure that economists, policymakers, and central bankers rely on for a simple reason: it tells us what is actually happening to the economy's productive capacity. When we ask whether the economy is growing, we want to know whether it is producing more goods and services—not just whether prices are rising. Real GDP answers that question.
Consider the question of recessions. In the United States, recessions are officially determined by the National Bureau of Economic Research, but a common rule of thumb is two consecutive quarters of negative GDP growth. When people talk about this rule, they are talking about real GDP, not nominal. During the 2008 financial crisis, nominal GDP fell in some quarters, but real GDP fell much more because prices were also falling. The recession was defined by the decline in real output, not the nominal numbers.
Consider the question of living standards. When we compare living standards over time, we want to know how much the average person can buy. If nominal GDP per capita rises but prices rise just as fast, real purchasing power has not changed. Real GDP per capita is the measure that tells us about actual living standards. When we say that U.S. real GDP per capita has more than doubled since 1980, we mean that the average American can buy more than twice as many goods and services today as they could forty years ago—after accounting for inflation.
Consider the question of international comparisons. When we compare the size of economies, we often use real GDP adjusted for purchasing power parity (PPP). This adjusts for differences in price levels across countries. China has a larger nominal GDP than the United States? Not quite—but when adjusted for PPP, which accounts for the fact that prices are lower in China, China's economy is larger. The key point is that both comparisons require adjusting for price differences, just as real GDP adjusts for price changes over time.
Consider the question of economic policy. When the Federal Reserve sets interest rates, it looks at real GDP growth to gauge whether the economy is overheating or underperforming. If real GDP is growing too fast, the economy might be at risk of inflation. If real GDP is growing too slowly, the economy might be at risk of recession. Nominal GDP alone would not give this information because it mixes together quantity and price effects.
Key takeaway: Real GDP matters because it tells us about actual production, living standards, and economic performance. Recessions are defined by declines in real GDP. Living standards are measured by real GDP per capita. Policymakers use real GDP to decide whether to raise or lower interest rates. Nominal GDP, without adjustment for inflation, can be deeply misleading.
A Walk Through Recent History – Real vs Nominal in Action
To see why this distinction matters in the real world, let us walk through three periods of recent U.S. economic history. In each period, the relationship between nominal and real GDP tells a different story.
The 1970s: Stagflation. Between 1970 and 1980, nominal GDP grew from about $1 trillion to about $2.8 trillion—an increase of 180 percent. On the surface, this looks like a period of rapid expansion. But when we adjust for inflation using the GDP deflator, real GDP grew by only about 30 percent over the same decade. The rest of the nominal growth was simply price increases. This was the era of stagflation—slow real growth combined with high inflation. Workers saw their wages rise in nominal terms, but their purchasing power stagnated. The gap between nominal and real GDP was enormous, and anyone who looked only at the nominal numbers would have completely misunderstood what was happening to the economy.
The 2008 Financial Crisis. In 2008, the economy entered a deep recession. Nominal GDP fell from about $14.7 trillion in the third quarter of 2008 to about $14.4 trillion in the second quarter of 2009—a decline of about 2 percent. Real GDP, however, fell from about $15.0 trillion (in chained 2012 dollars) to about $14.4 trillion over the same period—a decline of about 4 percent. The decline in real output was twice as large as the decline in nominal output because prices were also falling. The recession was even worse than the nominal numbers suggested. The recovery, too, looked different in real terms. By 2011, nominal GDP had returned to its pre-crisis peak, but real GDP did not return to its pre-crisis peak until 2013. The real recovery took much longer than the nominal recovery.
The COVID-19 Pandemic and 2021–2023 Inflation Surge. In the second quarter of 2020, nominal GDP fell at an annual rate of about 10 percent. Real GDP fell at an annual rate of 31 percent—the sharpest decline on record. The gap between nominal and real was enormous because prices were falling slightly (deflation) during the initial lockdowns. As the economy reopened, the pattern reversed. In 2021, nominal GDP surged at double-digit rates, but real GDP grew at a more modest pace. By 2022, nominal GDP was growing at over 9 percent annually, but real GDP was growing at only about 2 percent. Most of the nominal growth was inflation, not real expansion. This was the mirror image of the 1970s: high inflation that masked a more modest real economy.
These three episodes illustrate why economists never rely on nominal GDP alone. In the 1970s, nominal GDP made the economy look much stronger than it was. In 2008, nominal GDP made the recession look milder than it was. In 2021–2023, nominal GDP made the recovery look much stronger than it was. In each case, real GDP told the true story about what was happening to actual production.
Key takeaway: The gap between nominal and real GDP tells different stories in different periods. In the 1970s, nominal growth masked stagflation. In 2008, nominal declines understated the severity of the recession. In 2021–2023, nominal surges overstated the strength of the recovery. Real GDP is the only reliable measure of actual economic output.
Common Misconceptions and Pitfalls
Even after understanding the distinction between nominal and real GDP, there are several common misconceptions that can trip up readers of economic news. Let us address them directly.
Misconception: "Nominal GDP is the number that gets reported." In fact, when you hear a headline like "GDP grew by 2.5 percent," it is almost always real GDP. The Bureau of Economic Analysis prominently features real GDP in its releases. Nominal GDP is often called "current-dollar GDP" and is usually reported separately. Always check whether the number you are reading is real or nominal.
Misconception: "A higher nominal GDP means a stronger economy." Not necessarily. If nominal GDP rises entirely because of inflation, the economy is not producing more goods and services. Real GDP is the measure of actual economic strength.
Misconception: "The base year is the best year." The base year is not "the best year" or the most prosperous year. It is simply a reference point. The choice of base year affects the numbers but does not change the underlying reality of whether the economy is growing or shrinking.
Misconception: "Real GDP is just nominal GDP divided by the CPI." This is not correct. The GDP deflator is different from the CPI. The CPI measures consumer prices; the GDP deflator measures prices of all domestically produced goods and services, including investment goods, government purchases, and exports.
Misconception: "Real GDP is always lower than nominal GDP." This is true when inflation is positive, but during periods of deflation (falling prices), real GDP can be higher than nominal GDP. In the initial months of the COVID-19 pandemic, prices fell slightly, so real GDP fell less than nominal GDP? Actually, the opposite happened because the decline in quantity was so severe, but in principle, deflation can make real GDP higher than nominal GDP.
Key takeaway: Common pitfalls include confusing nominal and real GDP, assuming that nominal growth always means real growth, misunderstanding the base year, and confusing the GDP deflator with the CPI. Reading GDP reports with a critical eye means checking which measure is being used and understanding what it actually represents.
Conclusion: The Measure That Separates Growth from Illusion
We began this tutorial with the story of a worker who received a 10 percent raise only to find that prices had also risen 10 percent. The raise was an illusion—a nominal increase that did not translate into real purchasing power. This is exactly the problem that real GDP solves for the economy as a whole.
We have learned that nominal GDP measures output at current prices, while real GDP adjusts for inflation using constant prices from a base year. We have explored the GDP deflator, the tool that separates nominal GDP into quantity and price components. We have seen how the choice of base year affects the numbers and why statistical agencies use chain-weighted methods to keep measures accurate. We have walked through real-world examples—the stagflation of the 1970s, the financial crisis of 2008, the pandemic recession and inflation surge of 2020–2023—to see how the gap between nominal and real GDP tells different stories about the economy. And we have addressed common misconceptions that can trip up even experienced readers of economic news.
Why does this distinction matter? Because when we ask whether the economy is growing, we want to know whether people are actually producing more goods and services—not just whether prices are rising. When we compare living standards across time, we want to know how much the average person can buy—not just how many dollars they earn. When we debate economic policy, we need to know whether the economy is expanding or contracting in real terms—not just whether the numbers are going up. Real GDP gives us this information. It strips away the illusion of rising prices to reveal the underlying reality of economic production.
The next time you read that "GDP grew by 2.5 percent," you will know that this is almost certainly real GDP—the measure that matters. You will understand that this number represents the actual increase in the quantity of goods and services the economy produces, after removing the effects of inflation. You will know how to find the GDP deflator, how to interpret the base year, and how to spot the difference between nominal and real growth. And you will recognize that when inflation is high, nominal GDP can tell a very different—and often misleading—story from real GDP.
Real GDP is not a perfect measure. It has limitations, which we will explore in later tutorials. But it is the best tool we have for understanding whether the economy is genuinely growing or merely experiencing rising prices. In a world where inflation can distort our view of economic progress, real GDP is the compass that points toward the truth.
About Swati Sharma
Lead Editor at MyEyze, Economist & Finance Research WriterSwati Sharma is an economist with a Bachelor’s degree in Economics (Honours), CIPD Level 5 certification, and an MBA, and over 18 years of experience across management consulting, investment, and technology organizations. She specializes in research-driven financial education, focusing on economics, markets, and investor behavior, with a passion for making complex financial concepts clear, accurate, and accessible to a broad audience.
Disclaimer
This article is for educational purposes only and should not be interpreted as financial advice. Readers should consult a qualified financial professional before making investment decisions. Assistance from AI-powered generative tools was taken to format and improve language flow. While we strive for accuracy, this content may contain errors or omissions and should be independently verified.